
Construction and Demonstration of Vector Arrays
2020-10-09 17:45
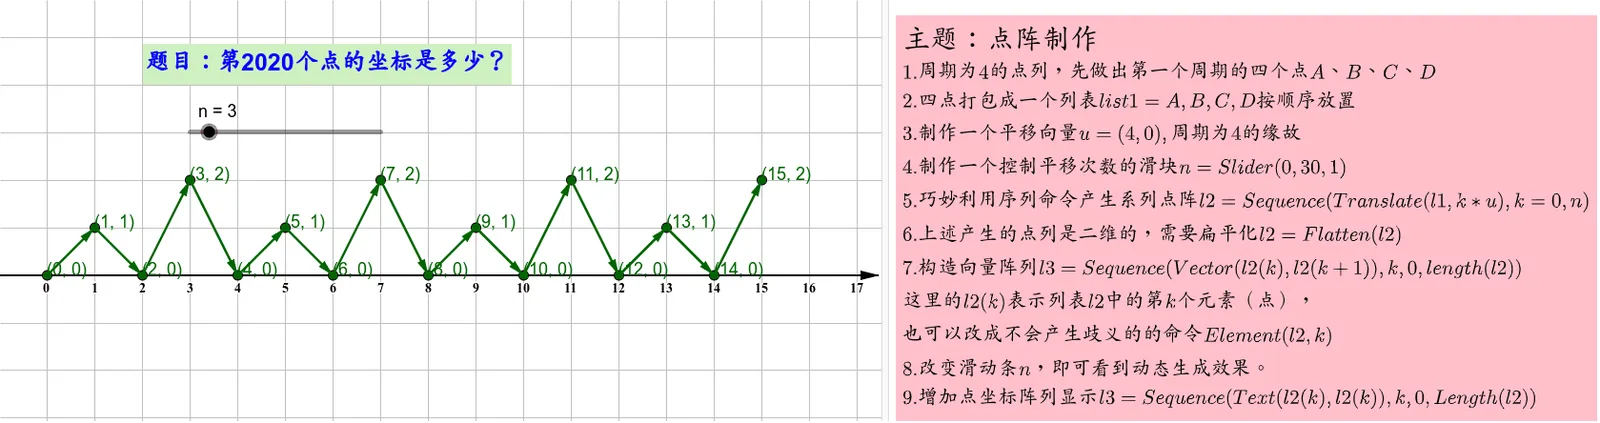
This example demonstrates how to construct 2D vector arrays using the Flatten and Sequence commands in GeoGebra. By defining base points and vectors, combined with sequence and list operations, a regularly arranged set of vectors is generated. This demonstration helps in understanding the geometric interpretation of vectors, linear combinations, and the application of geometric transformations in
Loading the GeoGebra board and drawing, please wait…
<?xml version="1.0" encoding="utf-8"?>
<geogebra format="5.0" version="5.0.608.0" app="classic" platform="d" id="c49e0e97-b6d9-4274-8b7a-534794180f36" xsi:noNamespaceSchemaLocation="http://www.geogebra.org/apps/xsd/ggb.xsd" xmlns="" xmlns:xsi="http://www.w3.org/2001/XMLSchema-instance" >
<gui>
<window width="1715" height="658" />
<perspectives>
<perspective id="tmp">
<panes>
<pane location="" divider="0.5393586005830904" orientation="1" />
</panes>
<views>
<view id="4097" visible="false" inframe="true" stylebar="true" location="1,1,1,1" size="400" window="700,407,1159,747" />
<view id="4" toolbar="0 || 2020 , 2021 , 2022 , 66 || 2001 , 2003 , 2002 , 2004 , 2005 || 2040 , 2041 , 2042 , 2044 , 2043" visible="false" inframe="false" stylebar="false" location="1,1" size="300" window="100,100,600,400" />
<view id="2" visible="false" inframe="false" stylebar="true" location="3,3" size="357" tab="ALGEBRA" window="100,100,600,400" />
<view id="8" toolbar="1001 | 1002 | 1003 || 1005 | 1004 || 1006 | 1007 | 1010 || 1008 1009 || 66 68 || 6" visible="false" inframe="false" stylebar="false" location="1,3" size="300" window="100,100,600,400" />
<view id="512" toolbar="0 | 1 501 5 19 , 67 | 2 15 45 18 , 7 37 | 514 3 9 , 13 44 , 47 | 16 | 551 550 11 , 20 22 21 23 , 55 56 57 , 12 | 69 | 510 511 , 512 513 | 533 531 , 534 532 , 522 523 , 537 536 , 535 | 521 520 | 36 , 38 49 560 | 571 30 29 570 31 33 | 17 | 540 40 41 42 , 27 28 35 , 6 , 502" visible="false" inframe="false" stylebar="true" location="1,1" size="432" window="100,100,600,400" />
<view id="1" visible="true" inframe="false" stylebar="true" location="3" size="925" window="100,100,600,400" />
<view id="16" visible="true" inframe="false" stylebar="false" location="1" size="752" window="50,50,500,500" />
<view id="32" visible="false" inframe="false" stylebar="true" location="1" size="150" window="50,50,500,500" />
<view id="64" toolbar="0" visible="false" inframe="true" stylebar="true" location="1" size="150" window="50,50,500,500" />
<view id="70" toolbar="0 || 2020 || 2021 || 2022" visible="false" inframe="true" stylebar="true" location="1" size="150" window="50,50,500,500" />
</views>
<toolbar show="true" items="0 39 73 62 | 1 501 67 , 5 19 , 72 75 76 | 2 15 45 , 18 65 , 7 37 | 4 3 8 9 , 13 44 , 58 , 47 | 16 51 64 , 70 | 10 34 53 11 , 24 20 22 , 21 23 | 55 56 57 , 12 | 36 46 , 38 49 50 , 71 14 68 | 30 29 54 32 31 33 | 25 17 26 60 52 61 | 40 41 42 , 27 28 35 , 6" position="1" help="false" />
<input show="true" cmd="true" top="algebra" />
<dockBar show="true" east="true" />
</perspective>
</perspectives>
<labelingStyle val="3"/>
<font size="18"/>
</gui>
<euclidianView>
<viewNumber viewNo="1"/>
<size width="925" height="409"/>
<coordSystem xZero="49.49999999999974" yZero="289.0" scale="49.99999999999998" yscale="49.99999999999998"/>
<evSettings axes="true" grid="true" gridIsBold="false" pointCapturing="3" rightAngleStyle="1" checkboxSize="26" gridType="0"/>
<bgColor r="255" g="255" b="255"/>
<axesColor r="0" g="0" b="0"/>
<gridColor r="192" g="192" b="192"/>
<lineStyle axes="11" grid="0"/>
<labelStyle axes="1" serif="true"/>
<axis id="0" show="true" label="" unitLabel="" tickStyle="1" showNumbers="true"/>
<axis id="1" show="false" label="" unitLabel="" tickStyle="1" showNumbers="true"/>
</euclidianView>
<euclidianView>
<viewNumber viewNo="2"/>
<size width="752" height="442"/>
<coordSystem xZero="6.00000000000002" yZero="504.99999999999966" scale="49.99999999999994" yscale="49.99999999999995"/>
<evSettings axes="false" grid="false" gridIsBold="false" pointCapturing="3" rightAngleStyle="1" checkboxSize="26" gridType="3"/>
<bgColor r="255" g="255" b="255"/>
<axesColor r="0" g="0" b="0"/>
<gridColor r="192" g="192" b="192"/>
<lineStyle axes="1" grid="0"/>
<axis id="0" show="false" label="" unitLabel="" tickStyle="1" showNumbers="true"/>
<axis id="1" show="false" label="" unitLabel="" tickStyle="1" showNumbers="true"/>
</euclidianView>
<algebraView>
<mode val="1"/>
<auxiliary show="true"/>
</algebraView>
<kernel>
<continuous val="false"/>
<usePathAndRegionParameters val="true"/>
<decimals val="2"/>
<angleUnit val="degree"/>
<algebraStyle val="0" spreadsheet="0"/>
<coordStyle val="0"/>
</kernel>
<tableview min="-2.0" max="2.0" step="1.0"/>
<scripting blocked="false" disabled="false"/>
<construction title="" author="" date="">
<expression label="A" exp="(0, 0)" type="point"/>
<element type="point" label="A">
<show object="false" label="true"/>
<objColor r="0" g="0" b="0" alpha="0.0"/>
<layer val="0"/>
<labelMode val="0"/>
<animation step="1" speed="1" type="1" playing="false"/>
<coords x="0.0" y="0.0" z="1.0"/>
<pointSize val="1"/>
<pointStyle val="10"/>
</element>
<expression label="B" exp="(1, 1)" type="point"/>
<element type="point" label="B">
<show object="false" label="true"/>
<objColor r="0" g="0" b="0" alpha="0.0"/>
<layer val="0"/>
<labelMode val="0"/>
<animation step="1" speed="1" type="1" playing="false"/>
<coords x="1.0" y="1.0" z="1.0"/>
<pointSize val="1"/>
<pointStyle val="10"/>
</element>
<expression label="C" exp="(2, 0)" type="point"/>
<element type="point" label="C">
<show object="false" label="true"/>
<objColor r="0" g="0" b="0" alpha="0.0"/>
<layer val="0"/>
<labelMode val="0"/>
<animation step="1" speed="1" type="1" playing="false"/>
<coords x="2.0" y="0.0" z="1.0"/>
<pointSize val="1"/>
<pointStyle val="10"/>
</element>
<expression label="D" exp="(3, 2)" type="point"/>
<element type="point" label="D">
<show object="false" label="true"/>
<objColor r="0" g="0" b="0" alpha="0.0"/>
<layer val="0"/>
<labelMode val="0"/>
<animation step="1" speed="1" type="1" playing="false"/>
<coords x="3.0" y="2.0" z="1.0"/>
<pointSize val="1"/>
<pointStyle val="10"/>
</element>
<expression label="l1" exp="{A, B, C, D}" />
<element type="list" label="l1">
<show object="false" label="false"/>
<objColor r="0" g="100" b="0" alpha="0.0"/>
<layer val="0"/>
<labelMode val="0"/>
<lineStyle thickness="5" type="0" typeHidden="1"/>
<pointSize val="5"/>
<angleStyle val="0"/>
</element>
<element type="numeric" label="n">
<value val="3.0"/>
<show object="true" label="true"/>
<objColor r="0" g="0" b="0" alpha="0.10000000149011612"/>
<layer val="0"/>
<labelMode val="1"/>
<slider min="0" max="30" absoluteScreenLocation="true" width="200.0" x="199.0" y="139.0" fixed="false" horizontal="true" showAlgebra="true"/>
<lineStyle thickness="10" type="0" typeHidden="1"/>
<animation step="1" speed="1" type="0" playing="false"/>
<ggbscript onUpdate=""/>
</element>
<expression label="u" exp="(4, 0)" type="vector"/>
<element type="vector" label="u">
<show object="false" label="false"/>
<objColor r="0" g="0" b="0" alpha="0.0"/>
<layer val="0"/>
<labelMode val="0"/>
<animation step="1" speed="1" type="0" playing="false"/>
<coords x="4.0" y="0.0" z="0.0"/>
<lineStyle thickness="5" type="0" typeHidden="1"/>
<coordStyle style="cartesian"/>
</element>
<command name="Flatten">
<input a0="Sequence[Translate[l1, Vector[(k * u)]], k, 0, n]"/>
<output a0="l2"/>
</command>
<element type="list" label="l2">
<show object="true" label="false"/>
<objColor r="0" g="100" b="0" alpha="0.0"/>
<layer val="0"/>
<labelMode val="0"/>
<lineStyle thickness="5" type="0" typeHidden="1"/>
<pointSize val="5"/>
<angleStyle val="0"/>
</element>
<command name="Sequence">
<input a0="Vector[l2(k), l2(k + 1)]" a1="k" a2="1" a3="Length[l2]"/>
<output a0="l3"/>
</command>
<element type="list" label="l3">
<show object="true" label="false"/>
<objColor r="0" g="100" b="0" alpha="0.0"/>
<layer val="0"/>
<labelMode val="0"/>
<lineStyle thickness="5" type="0" typeHidden="1"/>
<pointSize val="5"/>
<angleStyle val="0"/>
</element>
<expression label="text1" exp=""\Large{主题:点阵制作}\\
1. 周期为4的点列,先做出第一个周期的四个点A、B、C、D\\
2. 四点打包成一个列表 list1={A,B,C,D} 按顺序放置\\
3. 制作一个平移向量 u = (4,0), 周期为4的缘故\\
4. 制作一个控制平移次数的滑块 n=Slider(0,30,1)\\
5. 巧妙利用序列命令产生系列点阵 l2=Sequence(Translate(l1, k*u),k=0,n)\\
6. 上述产生的点列是二维的,需要扁平化 l2=Flatten(l2)\\
7. 构造向量阵列 l3=Sequence(Vector(l2(k),l2(k+1)),k,0,length(l2))\\
 这里的 l2(k) 表示 列表l2中的第k个元素(点),\\
 也可以改成不会产生歧义的的命令 Element(l2,k)\\
8. 改变滑动条n,即可看到动态生成效果。\\
9. 增加点坐标阵列显示 l3=Sequence(Text(l2(k), l2(k)), k, 0, Length(l2))""/>
<element type="text" label="text1">
<show object="true" label="false" ev="43"/>
<objColor r="0" g="0" b="0" alpha="0.0"/>
<bgColor r="255" g="192" b="203" alpha="255"/>
<layer val="0"/>
<labelMode val="0"/>
<fixed val="true"/>
<selectionAllowed val="false"/>
<isLaTeX val="true"/>
<font serif="true" sizeM="1.0" size="0" style="0"/>
<auxiliary val="true"/>
<startPoint x="0.07000000000000384" y="9.720000000000006" z="1.0"/>
<ggbscript val=""/>
<ggbscript onUpdate=""/>
</element>
<expression label="text2" exp=""题目:第2020个点的坐标是多少?""/>
<element type="text" label="text2">
<show object="true" label="false" ev="40"/>
<objColor r="0" g="0" b="255" alpha="0.0"/>
<bgColor r="208" g="240" b="192" alpha="255"/>
<layer val="0"/>
<labelMode val="0"/>
<fixed val="true"/>
<font serif="false" sizeM="1.4" size="8" style="1"/>
<absoluteScreenLocation x="153" y="74"/>
<ggbscript val=""/>
<ggbscript onUpdate=""/>
</element>
<command name="Sequence">
<input a0="Text[l2(k), l2(k)]" a1="k" a2="0" a3="Length[l2]"/>
<output a0="l4"/>
</command>
<element type="list" label="l4">
<show object="true" label="false"/>
<objColor r="0" g="100" b="0" alpha="0.0"/>
<layer val="0"/>
<labelMode val="0"/>
<lineStyle thickness="5" type="0" typeHidden="1"/>
<pointSize val="5"/>
<angleStyle val="0"/>
</element>
</construction>
</geogebra>