
Formation Process of the Sine Function Graph
2019-12-31 10:05
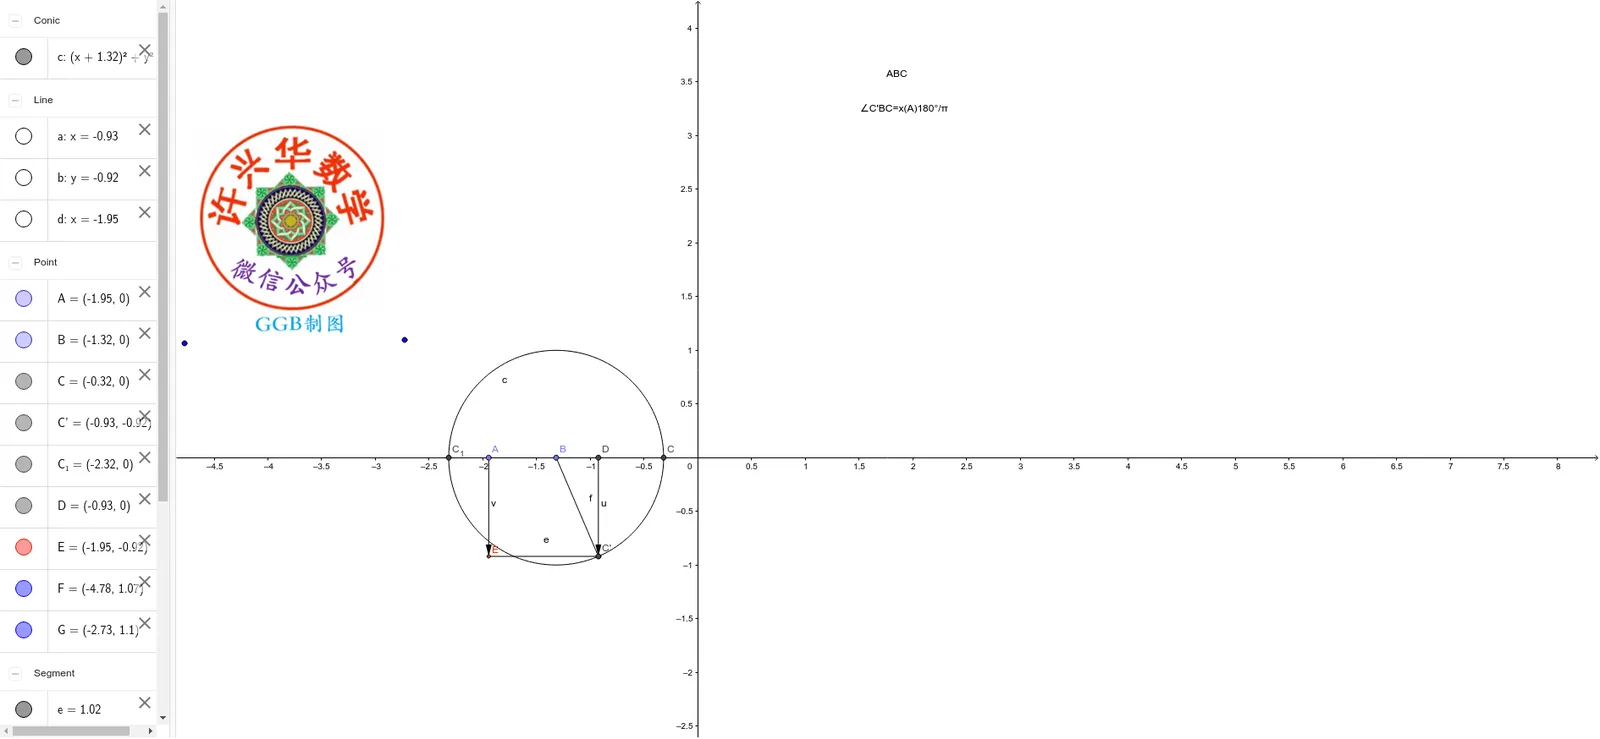
This applet dynamically demonstrates the formation process of the sine function graph. By constructing a moving point on the unit circle and utilizing geometric tools such as rotation, orthogonal lines, and vectors, it unrolls the sine line to visually show the correspondence between the angle change and the sine function value, helping to understand the geometric essence and generation principle
Loading the GeoGebra board and drawing, please wait…
<?xml version="1.0" encoding="utf-8"?>
<geogebra format="5.0" version="5.0.50.0" id="a12e9f43-0114-416e-8c25-17b1a8b78379" xsi:noNamespaceSchemaLocation="http://www.geogebra.org/ggb.xsd" xmlns="" xmlns:xsi="http://www.w3.org/2001/XMLSchema-instance" >
<gui>
<window width="1920" height="1040" />
<perspectives>
<perspective id="tmp">
<panes>
<pane location="" divider="0.10416666666666667" orientation="1" />
</panes>
<views>
<view id="4097" visible="false" inframe="true" stylebar="true" location="1,1,1,1" size="400" window="610,245,700,550" />
<view id="512" toolbar="0 | 1 501 5 19 , 67 | 2 15 45 18 , 7 37 | 514 3 9 , 13 44 , 47 | 16 | 551 550 11 , 22 , 23 , 55 56 57 , 12 | 69 | 510 511 , 512 513 | 533 531 , 534 532 , 522 523 , 537 536 , 535 | 521 520 | 36 , 38 49 560 | 571 30 29 570 31 33 | 17 | 540 40 41 42 , 27 28 35 , 6 , 502" visible="false" inframe="false" stylebar="false" location="1,1,1" size="500" window="100,100,600,400" />
<view id="4" toolbar="0 || 2020 , 2021 , 2022 , 66 || 2001 , 2003 , 2002 , 2004 , 2005 || 2040 , 2041 , 2042 , 2044 , 2043" visible="false" inframe="false" stylebar="false" location="1,1" size="300" window="100,100,600,400" />
<view id="8" toolbar="1001 | 1002 | 1003 || 1005 | 1004 || 1006 | 1007 | 1010 || 1008 1009 || 66 68 || 6" visible="false" inframe="false" stylebar="false" location="1,3" size="300" window="100,100,600,400" />
<view id="1" visible="true" inframe="false" stylebar="false" location="1" size="1688" window="100,100,600,400" />
<view id="2" visible="true" inframe="false" stylebar="false" location="3" size="200" window="100,100,250,400" />
<view id="16" visible="false" inframe="false" stylebar="false" location="1" size="150" window="50,50,500,500" />
<view id="32" visible="false" inframe="false" stylebar="true" location="1" size="150" window="50,50,500,500" />
<view id="64" toolbar="0" visible="false" inframe="true" stylebar="true" location="1" size="150" window="50,50,500,500" />
<view id="70" toolbar="0 || 2020 || 2021 || 2022" visible="false" inframe="true" stylebar="true" location="1" size="150" window="50,50,500,500" />
</views>
<toolbar show="true" items="0 39 | 1 501 67 , 5 19 , 72 | 2 15 45 , 18 65 , 7 37 | 4 3 8 9 , 13 44 , 58 , 47 | 16 51 64 , 70 | 10 34 53 11 , 24 20 22 , 21 23 | 55 56 57 , 12 | 36 46 , 38 49 50 , 71 | 30 29 54 32 31 33 | 17 26 62 73 , 14 68 | 25 52 60 61 | 40 41 42 , 27 28 35 , 6" position="1" help="false" />
<input show="true" cmd="true" top="false" />
<dockBar show="true" east="true" />
</perspective>
</perspectives>
<labelingStyle val="0"/>
<font size="12"/>
<graphicsSettings javaLatexFonts="false"/>
</gui>
<euclidianView>
<viewNumber viewNo="1"/>
<size width="1688" height="872"/>
<coordSystem xZero="616.3147550248433" yZero="541.2601497559076" scale="126.95572195100792" yscale="126.95572195100787"/>
<evSettings axes="true" grid="false" gridIsBold="false" pointCapturing="3" rightAngleStyle="1" checkboxSize="26" gridType="0"/>
<bgColor r="255" g="255" b="255"/>
<axesColor r="0" g="0" b="0"/>
<gridColor r="192" g="192" b="192"/>
<lineStyle axes="1" grid="10"/>
<axis id="0" show="true" label="" unitLabel="" tickStyle="1" showNumbers="true"/>
<axis id="1" show="true" label="" unitLabel="" tickStyle="1" showNumbers="true"/>
</euclidianView>
<kernel>
<continuous val="false"/>
<usePathAndRegionParameters val="true"/>
<decimals val="2"/>
<angleUnit val="degree"/>
<algebraStyle val="0"/>
<coordStyle val="0"/>
<angleFromInvTrig val="false"/>
<startAnimation val="true"/>
</kernel>
<scripting blocked="false" disabled="false"/>
<construction title="" author="" date="">
<command name="Point">
<input a0="xAxis"/>
<output a0="A"/>
</command>
<element type="point" label="A">
<show object="true" label="true"/>
<objColor r="125" g="125" b="255" alpha="0.0"/>
<layer val="0"/>
<labelMode val="0"/>
<animation step="0.1" speed="1" type="1" playing="true"/>
<coords x="-1.9456468132342768" y="0.0" z="1.0"/>
<pointSize val="3"/>
<pointStyle val="0"/>
</element>
<command name="Point">
<input a0="xAxis"/>
<output a0="B"/>
</command>
<element type="point" label="B">
<show object="true" label="true"/>
<objColor r="125" g="125" b="255" alpha="0.0"/>
<layer val="0"/>
<labelMode val="0"/>
<animation step="0.1" speed="1" type="1" playing="false"/>
<coords x="-1.3178984960552618" y="0.0" z="1.0"/>
<pointSize val="3"/>
<pointStyle val="0"/>
</element>
<command name="Circle">
<input a0="B" a1="1"/>
<output a0="c"/>
</command>
<element type="conic" label="c">
<show object="true" label="true"/>
<objColor r="0" g="0" b="0" alpha="0.0"/>
<layer val="0"/>
<labelMode val="0"/>
<lineStyle thickness="2" type="0" typeHidden="1"/>
<eigenvectors x0="1.0" y0="0.0" z0="1.0" x1="-0.0" y1="1.0" z1="1.0"/>
<matrix A0="1.0" A1="1.0" A2="0.7368564459047209" A3="0.0" A4="1.3178984960552618" A5="-0.0"/>
<eqnStyle style="specific"/>
</element>
<command name="Intersect">
<input a0="c" a1="xAxis"/>
<output a0="C_1" a1="C"/>
</command>
<element type="point" label="C_1">
<show object="true" label="true"/>
<objColor r="68" g="68" b="68" alpha="0.0"/>
<layer val="0"/>
<labelMode val="0"/>
<coords x="-2.3178984960552618" y="0.0" z="1.0"/>
<pointSize val="3"/>
<pointStyle val="0"/>
</element>
<element type="point" label="C">
<show object="true" label="true"/>
<objColor r="68" g="68" b="68" alpha="0.0"/>
<layer val="0"/>
<labelMode val="0"/>
<coords x="-0.31789849605526177" y="0.0" z="1.0"/>
<pointSize val="3"/>
<pointStyle val="0"/>
</element>
<command name="Rotate">
<input a0="C" a1="((x(A) * 108) * ° / π)" a2="B"/>
<output a0="C'"/>
</command>
<element type="point" label="C'">
<show object="true" label="true"/>
<objColor r="68" g="68" b="68" alpha="0.0"/>
<layer val="0"/>
<labelMode val="0"/>
<coords x="-0.9253432257146434" y="-0.9197284162880932" z="1.0"/>
<pointSize val="3"/>
<pointStyle val="0"/>
</element>
<command name="OrthogonalLine">
<input a0="C'" a1="xAxis"/>
<output a0="a"/>
</command>
<element type="line" label="a">
<show object="false" label="true"/>
<objColor r="0" g="0" b="0" alpha="0.0"/>
<layer val="0"/>
<labelMode val="0"/>
<coords x="-1.0" y="0.0" z="-0.9253432257146434"/>
<lineStyle thickness="2" type="0" typeHidden="1"/>
<eqnStyle style="implicit"/>
</element>
<command name="Intersect">
<input a0="xAxis" a1="a"/>
<output a0="D"/>
</command>
<element type="point" label="D">
<show object="true" label="true"/>
<objColor r="68" g="68" b="68" alpha="0.0"/>
<layer val="0"/>
<labelMode val="0"/>
<coords x="-0.9253432257146434" y="0.0" z="1.0"/>
<pointSize val="3"/>
<pointStyle val="0"/>
</element>
<command name="Vector">
<input a0="D" a1="C'"/>
<output a0="u"/>
</command>
<element type="vector" label="u">
<show object="true" label="true"/>
<objColor r="0" g="0" b="0" alpha="0.0"/>
<layer val="0"/>
<labelMode val="0"/>
<coords x="0.0" y="-0.9197284162880932" z="0.0"/>
<lineStyle thickness="2" type="0" typeHidden="1"/>
<coordStyle style="cartesian"/>
<startPoint exp="D"/>
</element>
<command name="Line">
<input a0="C'" a1="xAxis"/>
<output a0="b"/>
</command>
<element type="line" label="b">
<show object="false" label="true"/>
<objColor r="0" g="0" b="0" alpha="0.0"/>
<layer val="0"/>
<labelMode val="0"/>
<coords x="0.0" y="1.0" z="0.9197284162880932"/>
<lineStyle thickness="2" type="0" typeHidden="1"/>
<eqnStyle style="implicit"/>
</element>
<command name="OrthogonalLine">
<input a0="A" a1="b"/>
<output a0="d"/>
</command>
<element type="line" label="d">
<show object="false" label="true"/>
<objColor r="0" g="0" b="0" alpha="0.0"/>
<layer val="0"/>
<labelMode val="0"/>
<coords x="-1.0" y="0.0" z="-1.9456468132342768"/>
<lineStyle thickness="2" type="0" typeHidden="1"/>
<eqnStyle style="implicit"/>
</element>
<command name="Intersect">
<input a0="d" a1="b"/>
<output a0="E"/>
</command>
<element type="point" label="E">
<show object="true" label="true"/>
<objColor r="255" g="0" b="0" alpha="0.0"/>
<layer val="0"/>
<labelMode val="0"/>
<trace val="true"/>
<coords x="-1.9456468132342768" y="-0.9197284162880932" z="1.0"/>
<pointSize val="2"/>
<pointStyle val="0"/>
</element>
<command name="Vector">
<input a0="A" a1="E"/>
<output a0="v"/>
</command>
<element type="vector" label="v">
<show object="true" label="true"/>
<objColor r="0" g="0" b="0" alpha="0.0"/>
<layer val="0"/>
<labelMode val="0"/>
<coords x="0.0" y="-0.9197284162880932" z="0.0"/>
<lineStyle thickness="2" type="0" typeHidden="1"/>
<coordStyle style="cartesian"/>
<startPoint exp="A"/>
</element>
<command name="Segment">
<input a0="C'" a1="E"/>
<output a0="e"/>
</command>
<element type="segment" label="e">
<show object="true" label="true"/>
<objColor r="0" g="0" b="0" alpha="0.0"/>
<layer val="0"/>
<labelMode val="0"/>
<coords x="0.0" y="-1.0203035875196333" z="-0.9384022026824923"/>
<lineStyle thickness="2" type="0" typeHidden="1"/>
<outlyingIntersections val="false"/>
<keepTypeOnTransform val="true"/>
</element>
<command name="Segment">
<input a0="C'" a1="B"/>
<output a0="f"/>
</command>
<element type="segment" label="f">
<show object="true" label="true"/>
<objColor r="0" g="0" b="0" alpha="0.0"/>
<layer val="0"/>
<labelMode val="0"/>
<coords x="-0.9197284162880932" y="-0.3925552703406183" z="-1.2121086966053658"/>
<lineStyle thickness="2" type="0" typeHidden="1"/>
<outlyingIntersections val="false"/>
<keepTypeOnTransform val="true"/>
</element>
<expression label="文本1" exp=""ABC""/>
<element type="text" label="文本1">
<show object="true" label="true"/>
<objColor r="0" g="0" b="0" alpha="0.0"/>
<layer val="0"/>
<labelMode val="0"/>
<startPoint x="1.7540386644494115" y="3.5465920152040304" z="1.0"/>
</element>
<expression label="文本2" exp=""∠C'BC=x(A)180°/π""/>
<element type="text" label="文本2">
<show object="true" label="true"/>
<objColor r="0" g="0" b="0" alpha="0.0"/>
<layer val="0"/>
<labelMode val="0"/>
<startPoint x="1.50985904399904" y="3.2236447752535398" z="1.0"/>
</element>
<element type="point" label="F">
<show object="true" label="false"/>
<objColor r="0" g="0" b="255" alpha="0.0"/>
<layer val="0"/>
<labelMode val="0"/>
<animation step="1" speed="1" type="1" playing="false"/>
<coords x="-4.775796992110521" y="1.0654120009502561" z="1.0"/>
<pointSize val="3"/>
<pointStyle val="0"/>
</element>
<element type="point" label="G">
<show object="true" label="false"/>
<objColor r="0" g="0" b="255" alpha="0.0"/>
<layer val="0"/>
<labelMode val="0"/>
<animation step="0.1" speed="1" type="1" playing="false"/>
<coords x="-2.7278388851074062" y="1.0969190487503035" z="1.0"/>
<pointSize val="3"/>
<pointStyle val="0"/>
</element>
<element type="image" label="图像1">
<file name="a915216a4ed61608544fba18ad2c3e36\A许兴华数学GGB制图专用图片1.png"/>
<inBackground val="false"/>
<startPoint number="0" exp="F"/>
<startPoint number="1" exp="G"/>
<show object="true" label="true"/>
<objColor r="0" g="0" b="0" alpha="1.0"/>
<layer val="0"/>
<labelMode val="0"/>
<animation step="1" speed="1" type="0" playing="false"/>
</element>
</construction>
</geogebra>