
Locus of Parabola Vertices
2012-04-17 07:03
This applet demonstrates the locus of a parabola's vertex as its parameters change. By adjusting the quadratic function's coefficients, users can observe the vertex's translation and movement. It combines graphing and locus concepts to deepen understanding of quadratic properties, transformations, and parameter effects.
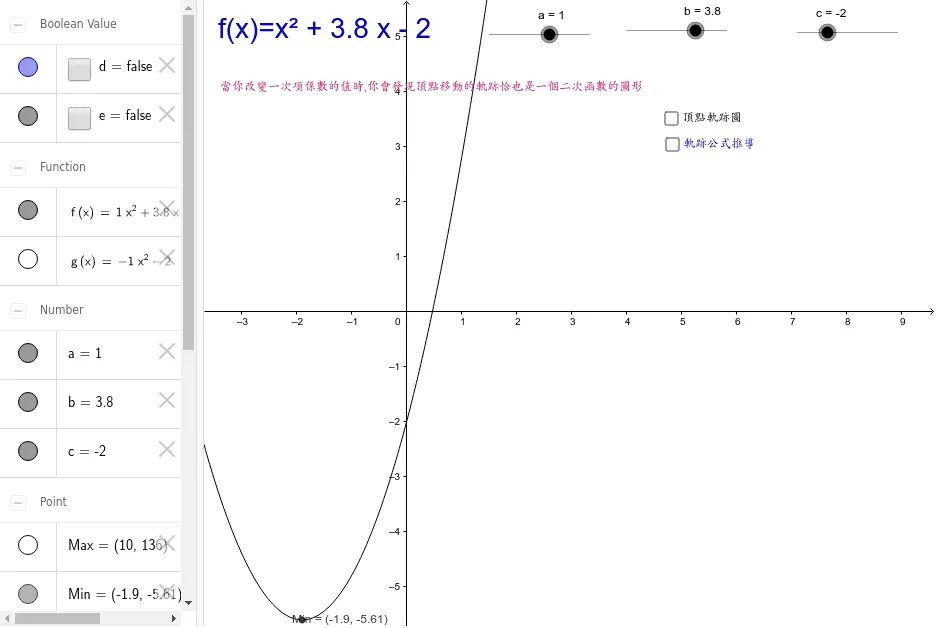
Loading the GeoGebra board and drawing, please wait…
<?xml version="1.0" encoding="utf-8"?>
<geogebra format="4.0" id="f963ba93-bb9b-427f-a736-5bc8d09e419d" xsi:noNamespaceSchemaLocation="http://www.geogebra.org/ggb.xsd" xmlns="" xmlns:xsi="http://www.w3.org/2001/XMLSchema-instance" >
<gui>
<window width="936" height="798" />
<perspectives>
<perspective id="tmp">
<panes>
<pane location="" divider="0.2094017094017094" orientation="1" />
</panes>
<views>
<view id="4" toolbar="0 || 2020 , 2021 , 2022 , 66 || 2001 , 2003 , 2002 , 2004 , 2005 || 2040 , 2041 , 2042 , 2044 , 2043" visible="false" inframe="false" stylebar="false" location="1,1" size="300" window="100,100,600,400" />
<view id="1" visible="true" inframe="false" stylebar="false" location="1" size="728" window="100,100,600,400" />
<view id="2" visible="true" inframe="false" stylebar="false" location="3" size="196" window="100,100,250,400" />
<view id="16" visible="false" inframe="true" stylebar="false" location="1" size="150" window="50,50,500,500" />
<view id="32" visible="false" inframe="true" stylebar="true" location="1" size="150" window="50,50,500,500" />
<view id="64" visible="false" inframe="true" stylebar="false" location="1" size="150" window="50,50,500,500" />
</views>
<toolbar show="true" items="0 39 59 || 1 501 67 , 5 19 , 72 | 2 15 45 , 18 65 , 7 37 | 4 3 8 9 , 13 44 , 58 , 47 || 16 51 64 , 70 | 10 34 53 11 , 24 20 22 , 21 23 | 55 56 57 , 12 || 36 46 , 38 49 50 , 71 | 30 29 54 32 31 33 | 17 26 62 , 14 66 68 | 25 52 60 61 || 40 41 42 , 27 28 35 , 6" />
<input show="true" cmd="true" top="false" />
</perspective>
</perspectives>
<labelingStyle val="3"/>
<font size="12"/>
<graphicsSettings javaLatexFonts="false"/>
<consProtColumns col0="true" col1="true" col2="false" col3="true" col4="false" col5="true" col6="true" col7="false"/>
<consProtocol useColors="true" addIcons="false" showOnlyBreakpoints="false"/>
</gui>
<euclidianView>
<size width="728" height="642"/>
<coordSystem xZero="202.70000000000005" yZero="311.4000000000001" scale="55.00000000000001" yscale="55.00000000000001"/>
<evSettings axes="true" grid="false" gridIsBold="false" pointCapturing="3" rightAngleStyle="1" checkboxSize="13" gridType="0"/>
<bgColor r="255" g="255" b="255"/>
<axesColor r="0" g="0" b="0"/>
<gridColor r="192" g="192" b="192"/>
<lineStyle axes="1" grid="10"/>
<axis id="0" show="true" label="" unitLabel="" tickStyle="1" showNumbers="true"/>
<axis id="1" show="true" label="" unitLabel="" tickStyle="1" showNumbers="true"/>
</euclidianView>
<kernel>
<continuous val="false"/>
<decimals val="2"/>
<angleUnit val="degree"/>
<algebraStyle val="0"/>
<coordStyle val="0"/>
<angleFromInvTrig val="false"/>
</kernel>
<scripting blocked="false" disabled="false"/>
<construction title="" author="" date="">
<element type="numeric" label="a">
<value val="1.0"/>
<show object="true" label="true"/>
<objColor r="0" g="0" b="0" alpha="0.1"/>
<layer val="0"/>
<labelMode val="1"/>
<slider min="-5" max="5" absoluteScreenLocation="true" width="100.0" x="285.0" y="35.0" fixed="true" horizontal="true"/>
<lineStyle thickness="2" type="0" typeHidden="1"/>
<animation step="0.1" speed="1" type="0" playing="false"/>
</element>
<element type="numeric" label="b">
<value val="3.8"/>
<show object="true" label="true"/>
<objColor r="0" g="0" b="0" alpha="0.1"/>
<layer val="0"/>
<labelMode val="1"/>
<slider min="-10" max="10" absoluteScreenLocation="true" width="100.0" x="422.0" y="31.0" fixed="true" horizontal="true"/>
<lineStyle thickness="2" type="0" typeHidden="1"/>
<animation step="0.1" speed="1" type="0" playing="false"/>
</element>
<element type="numeric" label="c">
<value val="-2.0"/>
<show object="true" label="true"/>
<objColor r="0" g="0" b="0" alpha="0.1"/>
<layer val="0"/>
<labelMode val="1"/>
<slider min="-5" max="5" absoluteScreenLocation="true" width="100.0" x="593.0" y="33.0" fixed="true" horizontal="true"/>
<lineStyle thickness="2" type="0" typeHidden="1"/>
<animation step="0.1" speed="1" type="0" playing="false"/>
</element>
<expression label="f" exp="f(x) = a * x^(2) + b * x + c" />
<element type="function" label="f">
<show object="true" label="false"/>
<objColor r="0" g="0" b="0" alpha="0.0"/>
<layer val="0"/>
<labelMode val="0"/>
<lineStyle thickness="2" type="0" typeHidden="1"/>
</element>
<expression label="text1" exp=""f(x)=" + f + """ />
<element type="text" label="text1">
<show object="true" label="false"/>
<objColor r="0" g="0" b="204" alpha="0.0"/>
<layer val="0"/>
<labelMode val="0"/>
<font serif="false" size="16" style="0"/>
<startPoint x="-3.4309090909090894" y="4.9709090909090925" z="1.0"/>
</element>
<command name="Min">
<input a0="f" a1="-10" a2="10"/>
<output a0="Min"/>
</command>
<element type="point" label="Min">
<show object="true" label="true"/>
<condition showObject="a > 0"/>
<objColor r="64" g="64" b="64" alpha="0.0"/>
<layer val="0"/>
<labelOffset x="-14" y="26"/>
<labelMode val="1"/>
<coords x="-1.9" y="-5.609999999999999" z="1.0"/>
<pointSize val="3"/>
<pointStyle val="0"/>
</element>
<command name="Max">
<input a0="f" a1="-10" a2="10"/>
<output a0="Max"/>
</command>
<element type="point" label="Max">
<show object="true" label="true"/>
<condition showObject="a < 0"/>
<objColor r="64" g="64" b="64" alpha="0.0"/>
<layer val="0"/>
<labelMode val="1"/>
<coords x="9.999999771177004" y="135.99999455401274" z="1.0"/>
<pointSize val="3"/>
<pointStyle val="0"/>
</element>
<expression label="g" exp="g(x) = -a * x^(2) + c" />
<element type="function" label="g">
<show object="true" label="false"/>
<condition showObject="e"/>
<objColor r="204" g="0" b="102" alpha="0.0"/>
<layer val="0"/>
<labelMode val="0"/>
<lineStyle thickness="3" type="20" typeHidden="1"/>
</element>
<expression label="text2" exp=""頂點座標公式=(\frac{-b}{2a},\frac{4ac-b^{2}}{4a})""/>
<element type="text" label="text2">
<show object="true" label="false"/>
<condition showObject="d"/>
<objColor r="0" g="0" b="0" alpha="0.0"/>
<layer val="0"/>
<labelMode val="0"/>
<isLaTeX val="true"/>
<font serif="true" size="0" style="0"/>
<startPoint x="4.769090909090908" y="-0.5927272727272711" z="1.0"/>
</element>
<expression label="text3" exp=""y=\frac{4ac-b^{2}}{4a}=\frac{4ac}{4a}-\frac{b^{2}}{4a}""/>
<element type="text" label="text3">
<show object="true" label="false"/>
<condition showObject="d"/>
<objColor r="0" g="0" b="0" alpha="0.0"/>
<layer val="0"/>
<labelMode val="0"/>
<isLaTeX val="true"/>
<font serif="true" size="0" style="0"/>
<startPoint x="5.15090909090909" y="-1.6836363636363618" z="1.0"/>
</element>
<expression label="text4" exp=""y=c-a*\frac{b^{2}}{4a^{2}}=c-ax^{2}""/>
<element type="text" label="text4">
<show object="true" label="false"/>
<condition showObject="d"/>
<objColor r="255" g="0" b="51" alpha="0.0"/>
<layer val="0"/>
<labelMode val="0"/>
<isLaTeX val="true"/>
<font serif="true" size="0" style="1"/>
<startPoint x="5.210909090909089" y="-2.7309090909090874" z="1.0"/>
</element>
<expression label="text5" exp=""當你改變一次項係數的值時,你會發現頂點移動的軌跡恰也是一個二次函數的圖形""/>
<element type="text" label="text5">
<show object="true" label="false"/>
<objColor r="204" g="0" b="102" alpha="0.0"/>
<layer val="0"/>
<labelMode val="0"/>
<startPoint x="-3.3945454545454554" y="4.0072727272727295" z="1.0"/>
</element>
<expression label="text6" exp=""g(x)=" + g + """ />
<element type="text" label="text6">
<show object="true" label="false"/>
<condition showObject="e ≟ true"/>
<objColor r="255" g="0" b="51" alpha="0.0"/>
<layer val="0"/>
<labelMode val="0"/>
<font serif="false" size="16" style="0"/>
<startPoint x="4.629090909090907" y="4.014545454545457" z="1.0"/>
</element>
<element type="boolean" label="d">
<value val="false"/>
<show object="true" label="true"/>
<objColor r="0" g="0" b="204" alpha="0.0"/>
<layer val="0"/>
<labelOffset x="457" y="133"/>
<labelMode val="0"/>
<caption val="軌跡公式推導"/>
</element>
<element type="boolean" label="e">
<value val="false"/>
<show object="true" label="true"/>
<objColor r="0" g="0" b="0" alpha="0.0"/>
<layer val="0"/>
<labelOffset x="456" y="107"/>
<labelMode val="0"/>
<caption val="頂點軌跡圖"/>
</element>
</construction>
</geogebra>