
About MathPlotAI: Chat with AI to Draw Interactive Math Graphs
You've probably been there—staring at y = sin x and struggling to picture the wave in your head; wanting to show a friend some love with a real equation-drawn heart instead of just an emoji; or prepping a lesson late at night and getting stuck on the software while trying to build an animated conic-section demo. MathPlotAI was built for exactly those moments.
Who We Are
MathPlotAI is an AI-powered mathematical-plotting and creator community. Describe the graph you want in plain language, and our AI turns it into a standard, interactive GeoGebra-powered graphic. You can also discover great work in the Gallery, stand on the shoulders of others through Community Cases and Community Books, and share your own creations. We are a team that believes math can be beautiful—and genuinely fun—powered by GeoGebra, the open-source math engine used in classrooms worldwide.
How It Works (Three Steps)
- Describe your need: Say it in natural language, e.g. "Plot y = sin(x) and mark the extrema."
- AI builds the canvas: The system converts your description into standard plotting commands and renders an interactive canvas you can drag, zoom, and tweak.
- Refine and export: Drag points, change parameters, or copy the commands in one click for use in slides, homework, and papers.
Generation is powered by RAG, retrieving the best construction ideas from 1000+ curated examples so results are more stable and closer to what you actually meant.
No Matter Your Age, There's a Place for You
- 🧒 Ages 12–18 · Students: Functions are more than exam symbols. Let AI draw hearts, snowflakes, and spinning spirals—turn "I don't get it" into "I want to keep playing."
- 🎓 Ages 18–25 · University & grad students: Homework, theses, math modeling—turn an idea into a clear visualization in one click.
- 👩🏫 Teachers & parents: Generate class materials in a few sentences, or reuse ready-made assets from Community Cases to turn "hard to explain" into "clear at a glance."
- 🧑🔬 Math enthusiasts of all ages: Create math art with parametric equations, publish it as a work, and earn appreciation from fellow fans.
Three Things We Strive To Do Well
- Plot accurately—graphics are powered by GeoGebra: interactive and verifiable, not just "looks about right" decoration.
- Learn fast—natural language is all you need to start; the example library and community let you build on others' work.
- Play for the long run—a Freemium credit system lets you start free and upgrade as you go; you can also bring your own AI key, and we never touch your secrets.
Why Choose MathPlotAI
Compared with using GeoGebra or Desmos directly, MathPlotAI adds a layer of "natural language → graph" AI capability plus a creator community in your language: the command manual helps you master plotting commands, while the Gallery and Community Books make good content searchable, reusable, and remixable. For teachers and researchers, this dramatically shortens the distance from "idea" to "interactive lesson."
The Heart
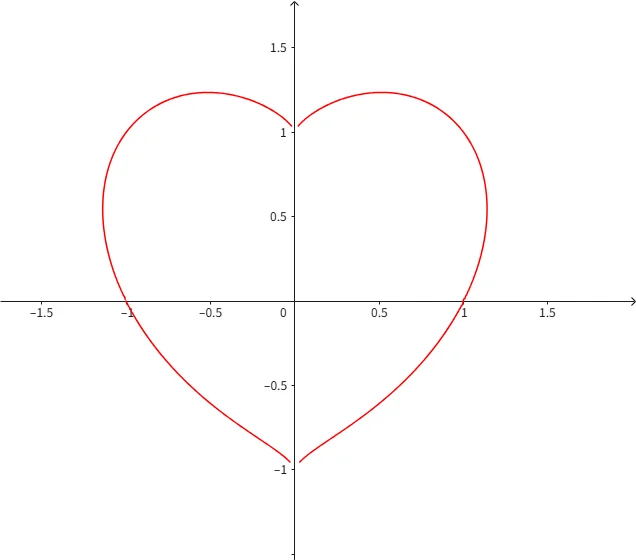
Our favorite example is this heart curve:
(x² + y² − 1)³ − x²·y³ = 0
It tells us one thing: math has warmth too. On MathPlotAI you can plot rigorous conic sections and also draw a heart for a friend—and that heart can be dragged and its parameters changed in real time.
Frequently Asked Questions
What is MathPlotAI?
MathPlotAI is an AI-powered mathematical-plotting and creator community. Describe the graph you want in plain language and our AI turns it into a standard, interactive GeoGebra-powered graphic; you can also browse, reuse, and share works through the gallery, community cases, and community books.
Do I need to install any software to use MathPlotAI?
No. MathPlotAI runs in your browser; graphics are rendered online via GeoGebra and support drag, zoom, and parameter tuning—no local installation required.
Is MathPlotAI free?
Start for free. The platform uses a Freemium credit system: basic use is free, and deeper use can be upgraded on demand. You can also use your own AI key, and we never touch your secrets.
How is MathPlotAI different from GeoGebra and Desmos?
MathPlotAI is built on GeoGebra and adds an AI layer that turns natural language into graphs, plus a creator community in your language: a command manual helps you master plotting commands, and the gallery and community books make good content searchable, reusable, and remixable.
Can the generated graphs be used in lessons or homework?
Yes. Every graph can be copied as standard plotting commands and exported for use directly in class slides, student homework, and paper visualizations.
What is the heart equation?
The classic heart implicit equation is (x² + y² − 1)³ − x²·y³ = 0. It draws a heart-shaped curve on the plane; in MathPlotAI you can plot it in one click and drag it or change parameters in real time to watch the shape shift.
Get Started
Sign up free to start drawing, or first browse the Gallery to see what others have created. Got feedback? Let us know—we'd love to hear from you.