
Domain and Range of Functions
2014-06-08 16:04
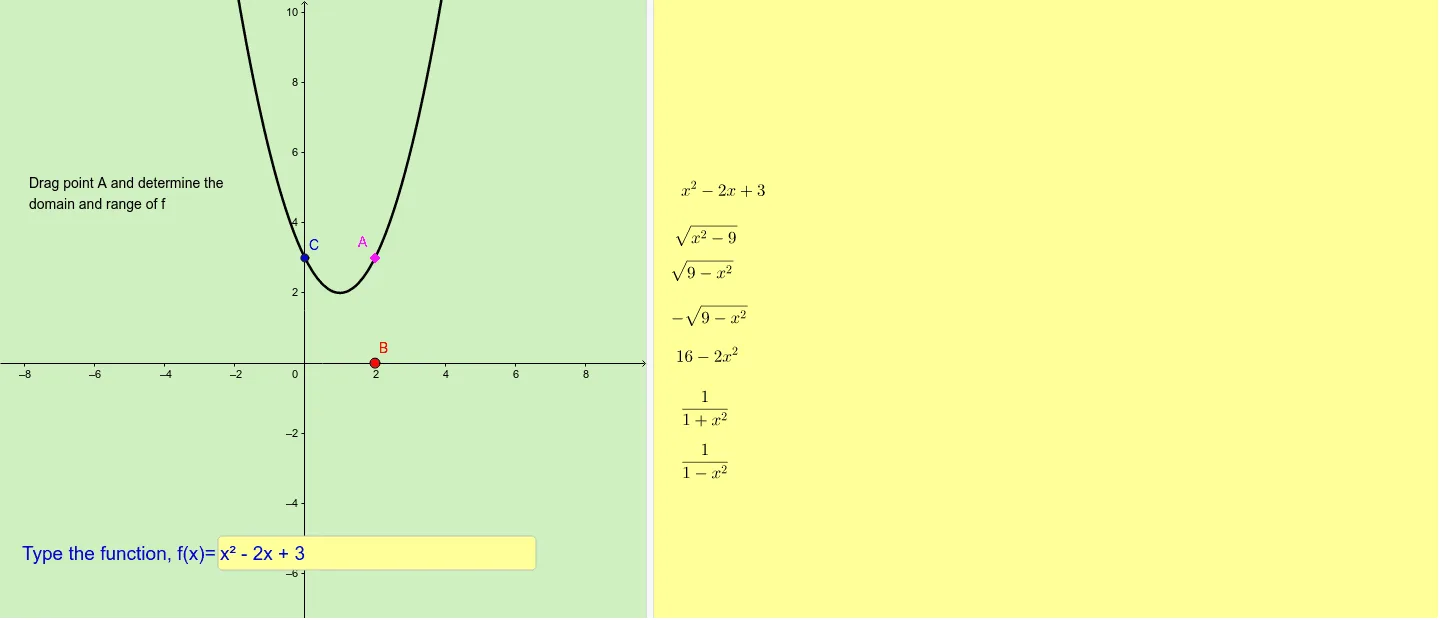
This applet demonstrates how to graphically determine the domain and range of a function. By observing the projection of the function's graph onto the x-axis and y-axis, and utilizing GeoGebra's input boxes and intersection tools, it helps users intuitively understand the constraints on the independent and dependent variables. An interactive tool for mastering fundamental function concepts.
In collections
函數
Loading the GeoGebra board and drawing, please wait…
<?xml version="1.0" encoding="utf-8"?>
<geogebra format="4.4" version="4.4.32.0" id="4890ec13-5d84-422c-8315-f840877afea3" xsi:noNamespaceSchemaLocation="http://www.geogebra.org/ggb.xsd" xmlns="" xmlns:xsi="http://www.w3.org/2001/XMLSchema-instance" >
<gui>
<window width="1440" height="790" />
<perspectives>
<perspective id="tmp">
<panes>
<pane location="" divider="0.4486111111111111" orientation="1" />
</panes>
<views>
<view id="4097" visible="false" inframe="true" stylebar="true" location="1,1,1" size="400" window="438,275,700,550" />
<view id="4" toolbar="0 59 || 2020 , 2021 , 2022 , 66 || 2001 , 2003 , 2002 , 2004 , 2005 || 2040 , 2041 , 2042 , 2044 , 2043" visible="false" inframe="false" stylebar="false" location="1,1" size="300" window="100,100,600,400" />
<view id="2" visible="false" inframe="false" stylebar="false" location="3,3" size="165" window="100,100,250,400" />
<view id="8" toolbar="1001 | 1002 | 1003 || 1005 | 1004 || 1006 | 1007 | 1010 | 1011 || 1008 1009 || 6" visible="false" inframe="false" stylebar="false" location="1,3" size="300" window="100,100,600,400" />
<view id="1" visible="true" inframe="false" stylebar="true" location="3" size="646" window="100,100,600,400" />
<view id="16" visible="true" inframe="false" stylebar="true" location="1" size="774" window="50,50,500,500" />
<view id="32" visible="false" inframe="false" stylebar="true" location="1" size="150" window="50,50,500,500" />
<view id="64" visible="false" inframe="true" stylebar="true" location="1" size="150" window="50,50,500,500" />
<view id="70" toolbar="0 || 2020 || 2021 || 2022" visible="false" inframe="true" stylebar="true" location="1" size="150" window="50,50,500,500" />
</views>
<toolbar show="true" items="0 39 59 | 1 501 67 , 5 19 , 72 | 2 15 45 , 18 65 , 7 37 | 4 3 8 9 , 13 44 , 58 , 47 | 16 51 64 , 70 | 10 34 53 11 , 24 20 22 , 21 23 | 55 56 57 , 12 | 36 46 , 38 49 50 , 71 | 30 29 54 32 31 33 | 17 26 62 73 , 14 66 68 | 25 52 60 61 | 40 41 42 , 27 28 35 , 6" position="1" help="false" />
<input show="true" cmd="true" top="false" />
<dockBar show="true" east="true" />
</perspective>
</perspectives>
<labelingStyle val="3"/>
<font size="14"/>
<graphicsSettings javaLatexFonts="false"/>
</gui>
<euclidianView>
<size width="646" height="633"/>
<coordSystem xZero="304.89307464886144" yZero="363.109269467956" scale="35.087962815005696" yscale="35.08796281500571"/>
<evSettings axes="true" grid="false" gridIsBold="false" pointCapturing="3" rightAngleStyle="1" checkboxSize="13" gridType="0"/>
<bgColor r="208" g="240" b="192"/>
<axesColor r="0" g="0" b="0"/>
<gridColor r="192" g="192" b="192"/>
<lineStyle axes="1" grid="10"/>
<axis id="0" show="true" label="" unitLabel="" tickStyle="1" showNumbers="true"/>
<axis id="1" show="true" label="" unitLabel="" tickStyle="1" showNumbers="true"/>
</euclidianView>
<euclidianView>
<viewNumber viewNo="2"/>
<size width="774" height="633"/>
<coordSystem xZero="215.00000000000003" yZero="314.9999999999999" scale="50.00000000000001" yscale="49.999999999999986"/>
<evSettings axes="false" grid="false" gridIsBold="false" pointCapturing="3" rightAngleStyle="1" checkboxSize="13" gridType="0"/>
<bgColor r="255" g="255" b="153"/>
<axesColor r="0" g="0" b="0"/>
<gridColor r="192" g="192" b="192"/>
<lineStyle axes="1" grid="10"/>
<axis id="0" show="false" label="" unitLabel="" tickStyle="1" showNumbers="true"/>
<axis id="1" show="false" label="" unitLabel="" tickStyle="1" showNumbers="true"/>
</euclidianView>
<kernel>
<continuous val="false"/>
<usePathAndRegionParameters val="true"/>
<decimals val="2"/>
<angleUnit val="degree"/>
<algebraStyle val="0"/>
<coordStyle val="0"/>
<angleFromInvTrig val="false"/>
</kernel>
<scripting blocked="false" disabled="false"/>
<construction title="Domain and Range of Functions" author="" date="24 November 2013">
<worksheetText above="Identify Domain and range of functions" below=""/>
<expression label ="f" exp="f(x) = x^(2) - (2 * x) + 3"/>
<element type="function" label="f">
<show object="true" label="false"/>
<objColor r="0" g="0" b="0" alpha="0.0"/>
<layer val="0"/>
<labelMode val="0"/>
<animation step="0.1" speed="1" type="0" playing="false"/>
<lineStyle thickness="5" type="0" typeHidden="1"/>
</element>
<command name="Point">
<input a0="f"/>
<output a0="A"/>
</command>
<element type="point" label="A">
<show object="true" label="true"/>
<objColor r="255" g="0" b="255" alpha="0.0"/>
<layer val="0"/>
<labelOffset x="-21" y="-3"/>
<labelMode val="0"/>
<animation step="0.1" speed="1" type="1" playing="false"/>
<coords x="1.9980335057000442" y="2.9960708784999204" z="1.0"/>
<pointSize val="4"/>
<pointStyle val="4"/>
</element>
<element type="line" label="a">
<show object="false" label="false"/>
<objColor r="0" g="0" b="0" alpha="0.0"/>
<layer val="0"/>
<labelMode val="0"/>
<animation step="0.1" speed="1" type="0" playing="false"/>
<coords x="0.0" y="1.0" z="0.0"/>
<lineStyle thickness="2" type="0" typeHidden="1"/>
<eqnStyle style="explicit"/>
</element>
<command name="OrthogonalLine">
<input a0="A" a1="a"/>
<output a0="b"/>
</command>
<element type="line" label="b">
<show object="false" label="false"/>
<objColor r="0" g="0" b="0" alpha="0.0"/>
<layer val="0"/>
<labelMode val="0"/>
<coords x="-1.0" y="0.0" z="1.9980335057000442"/>
<lineStyle thickness="2" type="0" typeHidden="1"/>
<eqnStyle style="implicit"/>
</element>
<command name="Intersect">
<input a0="a" a1="b"/>
<output a0="B"/>
</command>
<element type="point" label="B">
<show object="true" label="true"/>
<objColor r="255" g="0" b="0" alpha="0.0"/>
<layer val="0"/>
<labelMode val="0"/>
<trace val="true"/>
<coords x="1.9980335057000442" y="-0.0" z="1.0"/>
<pointSize val="5"/>
<pointStyle val="0"/>
</element>
<expression label="text3" exp=""\sqrt{x^2-9}""/>
<element type="text" label="text3">
<show object="true" label="false" ev="3"/>
<objColor r="0" g="0" b="0" alpha="0.0"/>
<layer val="0"/>
<labelMode val="0"/>
<isLaTeX val="true"/>
<font serif="true" sizeM="1.0" size="0" style="0"/>
<startPoint x="-3.980000000000001" y="1.8799999999999983" z="1.0"/>
</element>
<expression label="text4" exp=""\sqrt{9- x^2}""/>
<element type="text" label="text4">
<show object="true" label="false" ev="3"/>
<objColor r="0" g="0" b="0" alpha="0.0"/>
<layer val="0"/>
<labelMode val="0"/>
<isLaTeX val="true"/>
<font serif="true" sizeM="1.0" size="0" style="0"/>
<startPoint x="-4.0600000000000005" y="1.1799999999999993" z="1.0"/>
</element>
<expression label="text5" exp=""x^{2}-2x+3""/>
<element type="text" label="text5">
<show object="true" label="false" ev="3"/>
<objColor r="0" g="0" b="0" alpha="0.0"/>
<layer val="0"/>
<labelMode val="0"/>
<isLaTeX val="true"/>
<font serif="true" sizeM="1.0" size="0" style="0"/>
<startPoint x="-3.839999999999999" y="2.7599999999999993" z="1.0"/>
</element>
<expression label="text6" exp=""-\sqrt{9-x^2}""/>
<element type="text" label="text6">
<show object="true" label="false" ev="3"/>
<objColor r="0" g="0" b="0" alpha="0.0"/>
<layer val="0"/>
<labelMode val="0"/>
<isLaTeX val="true"/>
<font serif="true" sizeM="1.0" size="0" style="0"/>
<startPoint x="-4.04" y="0.2799999999999989" z="1.0"/>
</element>
<expression label="text7" exp=""16-2x^2""/>
<element type="text" label="text7">
<show object="true" label="false" ev="3"/>
<objColor r="0" g="0" b="0" alpha="0.0"/>
<layer val="0"/>
<labelMode val="0"/>
<isLaTeX val="true"/>
<font serif="true" sizeM="1.0" size="0" style="0"/>
<startPoint x="-3.9400000000000004" y="-0.5600000000000014" z="1.0"/>
</element>
<expression label="text8" exp=""\frac{1}{1+x^2}""/>
<element type="text" label="text8">
<show object="true" label="false" ev="3"/>
<objColor r="0" g="0" b="0" alpha="0.0"/>
<layer val="0"/>
<labelMode val="0"/>
<isLaTeX val="true"/>
<font serif="true" sizeM="1.0" size="0" style="0"/>
<startPoint x="-3.8400000000000003" y="-1.4400000000000013" z="1.0"/>
</element>
<expression label="text9" exp=""\frac{1}{1-x^2}""/>
<element type="text" label="text9">
<show object="true" label="false" ev="3"/>
<objColor r="0" g="0" b="0" alpha="0.0"/>
<layer val="0"/>
<labelMode val="0"/>
<isLaTeX val="true"/>
<font serif="true" sizeM="1.0" size="0" style="0"/>
<startPoint x="-3.839999999999999" y="-2.5000000000000018" z="1.0"/>
</element>
<command name="Textfield">
<input a0="f"/>
<output a0="inputBox1"/>
</command>
<element type="textfield" label="inputBox1">
<show object="true" label="true"/>
<objColor r="0" g="0" b="204" alpha="0.4"/>
<bgColor r="255" g="255" b="153" alpha="255"/>
<layer val="0"/>
<labelOffset x="22" y="536"/>
<labelMode val="0"/>
<animation step="1" speed="1" type="0" playing="false"/>
<auxiliary val="true"/>
<font serif="false" sizeM="1.4" size="6" style="0"/>
<file name="/geogebra/gui/images/go-next.png"/>
<linkedGeo exp="f"/>
<caption val="Type the function, f(x)="/>
</element>
<command name="OrthogonalLine">
<input a0="A" a1="yAxis"/>
<output a0="c"/>
</command>
<element type="line" label="c">
<show object="false" label="false"/>
<objColor r="0" g="0" b="0" alpha="0.0"/>
<layer val="0"/>
<labelMode val="0"/>
<coords x="0.0" y="-1.0" z="2.9960708784999204"/>
<lineStyle thickness="2" type="0" typeHidden="1"/>
<eqnStyle style="implicit"/>
</element>
<command name="Intersect">
<input a0="c" a1="yAxis"/>
<output a0="C"/>
</command>
<element type="point" label="C">
<show object="true" label="true"/>
<objColor r="0" g="0" b="255" alpha="0.0"/>
<layer val="0"/>
<labelMode val="0"/>
<trace val="true"/>
<coords x="0.0" y="2.9960708784999204" z="1.0"/>
<pointSize val="4"/>
<pointStyle val="0"/>
</element>
<expression label="text1" exp=""Drag point A and determine the domain and range of f""/>
<element type="text" label="text1">
<show object="true" label="false"/>
<objColor r="0" g="0" b="0" alpha="0.0"/>
<layer val="0"/>
<labelMode val="0"/>
<startPoint x="-7.862898057189949" y="4.990579544078541" z="1.0"/>
</element>
</construction>
</geogebra>