
Exploration of Quadratic Functions and Geometric Properties
2015-07-23 07:35
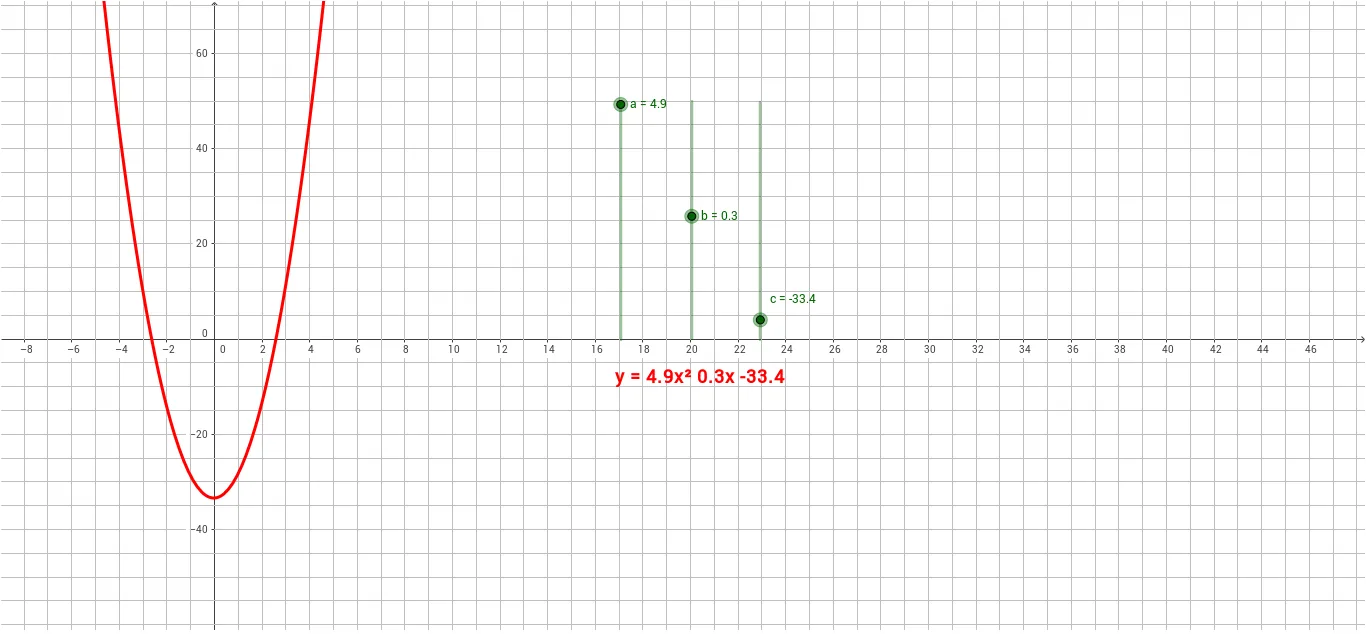
This applet demonstrates the graph and geometric properties of quadratic functions. By constructing the function's graph with points and segments, it illustrates key parabola features like the vertex, axis of symmetry, and intercepts. Users can adjust parameters to explore the connection between algebraic expressions and geometric graphs, ideal for math teaching and self-study.
Loading the GeoGebra board and drawing, please wait…
<?xml version="1.0" encoding="utf-8"?>
<geogebra format="5.0" version="5.0.134.0" id="d51fba8d-887b-419b-a681-4325a0f55a46" xsi:noNamespaceSchemaLocation="http://www.geogebra.org/ggb.xsd" xmlns="" xmlns:xsi="http://www.w3.org/2001/XMLSchema-instance" >
<gui>
<window width="1366" height="728" />
<perspectives>
<perspective id="tmp">
<panes>
<pane location="" divider="0.0" orientation="0" />
</panes>
<views>
<view id="4" toolbar="0 || 2020 , 2021 , 2022 , 66 || 2001 , 2003 , 2002 , 2004 , 2005 || 2040 , 2041 , 2042 , 2044 , 2043" visible="false" inframe="false" stylebar="false" location="2,2" size="200" window="0,0,400,400" />
<view id="1" visible="true" inframe="false" stylebar="true" location="2" size="582" window="0,0,400,400" />
<view id="2" visible="false" inframe="false" stylebar="false" location="0" size="200" window="0,0,200,400" />
<view id="8" toolbar="1001 | 1002 | 1003 || 1005 | 1004 || 1006 | 1007 | 1010 || 1008 1009 || 66 68 || 6" visible="false" inframe="false" stylebar="false" location="1" size="150" window="50,50,500,500" />
<view id="16" visible="false" inframe="true" stylebar="false" location="1" size="150" window="50,50,500,500" />
<view id="32" visible="false" inframe="true" stylebar="true" location="1" size="150" window="50,50,500,500" />
<view id="64" toolbar="0" visible="false" inframe="true" stylebar="false" location="1" size="150" window="50,50,500,500" />
<view id="4097" visible="false" inframe="true" stylebar="true" location="1" size="150" window="50,50,500,500" />
<view id="70" toolbar="0 || 2020 || 2021 || 2022" visible="false" inframe="true" stylebar="true" location="1" size="150" window="50,50,500,500" />
<view id="512" toolbar="0 | 1 501 5 19 , 67 | 2 15 45 18 , 7 37 | 514 3 9 , 13 44 , 47 | 16 | 551 550 11 , 20 22 21 23 , 55 56 57 , 12 | 69 | 510 511 , 512 513 | 533 531 , 534 532 , 522 523 , 537 536 , 535 | 521 520 | 36 , 38 49 560 | 571 30 29 570 31 33 | 17 | 540 40 41 42 , 27 28 35 , 6 , 502" visible="false" inframe="false" stylebar="false" location="1" size="300" window="50,50,500,500" />
</views>
<toolbar show="true" items="0 39 59 || 1 501 67 , 5 19 , 72 | 2 15 45 , 18 65 , 7 37 | 4 3 8 9 , 13 44 , 58 , 47 || 16 51 64 , 70 | 10 34 53 11 , 24 20 22 , 21 23 | 55 56 57 , 12 || 36 46 , 38 49 50 , 71 | 30 29 54 32 31 33 | 17 26 62 , 14 66 68 | 25 52 60 61 || 40 41 42 , 27 28 35 , 6" position="1" help="true" />
<input show="true" cmd="true" top="false" />
<dockBar show="false" east="false" />
</perspective>
</perspectives>
<labelingStyle val="3"/>
<font size="12"/>
<graphicsSettings javaLatexFonts="false"/>
</gui>
<euclidianView>
<viewNumber viewNo="1"/>
<size width="1350" height="557"/>
<coordSystem xZero="213.5446860745825" yZero="338.023520673459" scale="23.801136786716192" yscale="4.76022735734324"/>
<evSettings axes="true" grid="true" gridIsBold="false" pointCapturing="1" rightAngleStyle="2" checkboxSize="13" gridType="0"/>
<bgColor r="255" g="255" b="255"/>
<axesColor r="64" g="64" b="64"/>
<gridColor r="192" g="192" b="192"/>
<lineStyle axes="1" grid="0"/>
<axis id="0" show="true" label="" unitLabel="" tickStyle="0" showNumbers="true"/>
<axis id="1" show="true" label="" unitLabel="" tickStyle="0" showNumbers="true"/>
<grid distX="1.0" distY="5.0" distTheta="0.5235987755982988"/>
</euclidianView>
<kernel>
<continuous val="true"/>
<usePathAndRegionParameters val="true"/>
<decimals val="2"/>
<angleUnit val="degree"/>
<algebraStyle val="0"/>
<coordStyle val="0"/>
<angleFromInvTrig val="false"/>
</kernel>
<scripting blocked="false" disabled="false"/>
<construction title="二次函数" author="" date="">
<element type="numeric" label="a">
<value val="4.9"/>
<show object="true" label="true"/>
<objColor r="0" g="102" b="0" alpha="0.1"/>
<layer val="0"/>
<labelMode val="1"/>
<slider min="-5" max="5" width="50.0" x="17.06618511211168" y="-0.22962726389101107" fixed="false" horizontal="false"/>
<lineStyle thickness="5" type="0" typeHidden="1"/>
<animation step="0.1" speed="1" type="0" playing="false"/>
</element>
<element type="numeric" label="b">
<value val="0.3"/>
<show object="true" label="true"/>
<objColor r="0" g="102" b="0" alpha="0.1"/>
<layer val="0"/>
<labelMode val="1"/>
<slider min="-10" max="10" width="50.0" x="20.05049627415085" y="0.042816345493885244" fixed="false" horizontal="false"/>
<lineStyle thickness="5" type="0" typeHidden="1"/>
<animation step="0.1" speed="1" type="0" playing="false"/>
</element>
<element type="numeric" label="c">
<value val="-33.4"/>
<show object="true" label="true"/>
<objColor r="0" g="102" b="0" alpha="0.1"/>
<layer val="0"/>
<labelOffset x="1" y="-21"/>
<labelMode val="1"/>
<slider min="-40" max="40" width="50.0" x="22.930522276907446" y="-0.10682881775681974" fixed="false" horizontal="false"/>
<lineStyle thickness="5" type="0" typeHidden="1"/>
<animation step="0.1" speed="1" type="0" playing="false"/>
</element>
<expression label="f" exp="f(x) = (a * x^(2)) + (b * x) + c" />
<element type="function" label="f">
<show object="false" label="true"/>
<objColor r="153" g="0" b="0" alpha="0.0"/>
<layer val="0"/>
<labelMode val="1"/>
<lineStyle thickness="5" type="0" typeHidden="1"/>
</element>
<expression label="T1" exp=""Para modificar el valor de cada parámetro, ""/>
<element type="text" label="T1">
<show object="false" label="true"/>
<objColor r="0" g="102" b="0" alpha="0.0"/>
<layer val="0"/>
<labelMode val="0"/>
<auxiliary val="false"/>
<absoluteScreenLocation x="346" y="250"/>
</element>
<expression label="T3" exp=""desliza los puntos verdes o bien pulsa + o - tras ""/>
<element type="text" label="T3">
<show object="false" label="true"/>
<objColor r="0" g="102" b="0" alpha="0.0"/>
<layer val="0"/>
<labelMode val="0"/>
<auxiliary val="false"/>
<absoluteScreenLocation x="343" y="265"/>
</element>
<expression label="T4" exp=""seleccionar el parámetro en la ventana de la izquierda ""/>
<element type="text" label="T4">
<show object="false" label="true"/>
<objColor r="0" g="102" b="0" alpha="0.0"/>
<layer val="0"/>
<labelMode val="0"/>
<auxiliary val="false"/>
<absoluteScreenLocation x="341" y="281"/>
</element>
<command name="Point">
<input a0="f"/>
<output a0="P"/>
</command>
<element type="point" label="P">
<show object="false" label="true"/>
<objColor r="125" g="125" b="255" alpha="0.0"/>
<layer val="0"/>
<labelMode val="2"/>
<animation step="0.1" speed="1" type="1" playing="false"/>
<coords x="2.3701886394637266" y="-5.16175189361061" z="1.0"/>
<pointSize val="2"/>
<pointStyle val="0"/>
</element>
<expression label="A" exp="(x(P), 0)" type="point" />
<element type="point" label="A">
<show object="false" label="false"/>
<objColor r="64" g="64" b="64" alpha="0.0"/>
<layer val="0"/>
<labelMode val="0"/>
<coords x="2.3701886394637266" y="0.0" z="1.0"/>
<pointSize val="2"/>
<pointStyle val="0"/>
</element>
<expression label="B" exp="(0, y(P))" type="point" />
<element type="point" label="B">
<show object="false" label="false"/>
<objColor r="64" g="64" b="64" alpha="0.0"/>
<layer val="0"/>
<labelMode val="0"/>
<coords x="0.0" y="-5.16175189361061" z="1.0"/>
<pointSize val="2"/>
<pointStyle val="0"/>
</element>
<command name="Segment">
<input a0="B" a1="P"/>
<output a0="d"/>
</command>
<element type="segment" label="d">
<show object="false" label="false"/>
<objColor r="0" g="0" b="0" alpha="0.0"/>
<layer val="0"/>
<labelMode val="0"/>
<coords x="0.0" y="2.3701886394637266" z="12.234325697966247"/>
<lineStyle thickness="2" type="20" typeHidden="1"/>
<eqnStyle style="implicit"/>
<outlyingIntersections val="false"/>
<keepTypeOnTransform val="true"/>
</element>
<command name="Segment">
<input a0="P" a1="A"/>
<output a0="e"/>
</command>
<element type="segment" label="e">
<show object="false" label="false"/>
<objColor r="0" g="0" b="0" alpha="0.0"/>
<layer val="0"/>
<labelMode val="0"/>
<coords x="-5.16175189361061" y="0.0" z="12.234325697966247"/>
<lineStyle thickness="2" type="20" typeHidden="1"/>
<eqnStyle style="implicit"/>
<outlyingIntersections val="false"/>
<keepTypeOnTransform val="true"/>
</element>
<command name="Function">
<input a0="f" a1="-15" a2="15"/>
<output a0="g"/>
</command>
<element type="function" label="g">
<show object="true" label="false"/>
<objColor r="255" g="0" b="0" alpha="0.0"/>
<layer val="0"/>
<labelMode val="0"/>
<lineStyle thickness="6" type="0" typeHidden="1"/>
</element>
<expression label="T2" exp=""y = " + a + "x² " + b + "x " + c" />
<element type="text" label="T2">
<show object="true" label="false"/>
<objColor r="255" g="0" b="0" alpha="0.0"/>
<layer val="0"/>
<labelMode val="0"/>
<font serif="false" sizeM="1.5" size="6" style="1"/>
<auxiliary val="false"/>
<absoluteScreenLocation x="614" y="382"/>
</element>
</construction>
</geogebra>