
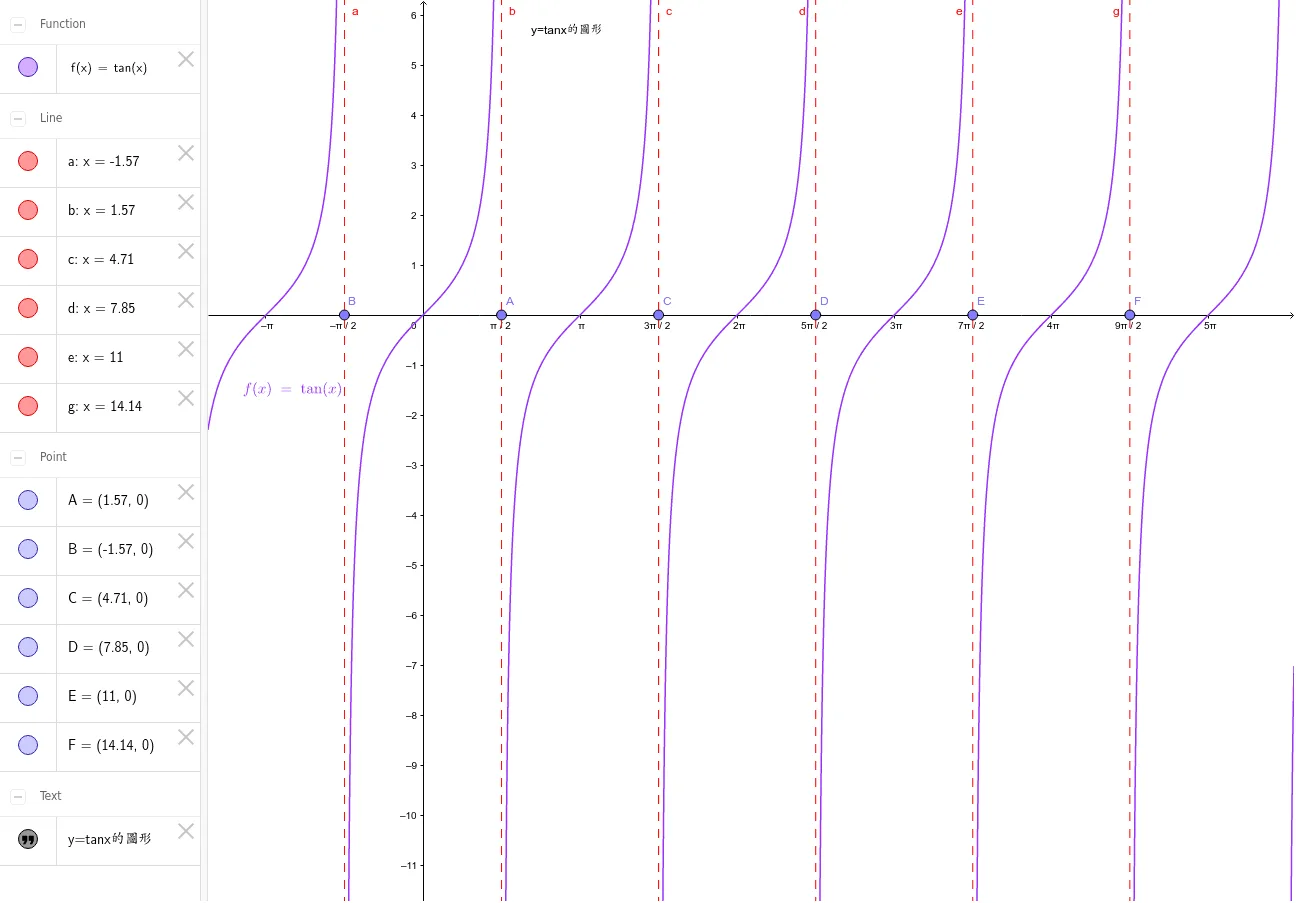
Graph of the Tangent Function y=tan(x)
2015-11-05 04:01
This applet demonstrates the graph of the tangent function y=tan(x). It visually illustrates the periodicity, vertical asymptotes, and monotonically increasing behavior of the tangent function. Ideal for teaching and learning trigonometry, helping students deeply understand the geometric meaning and graphical characteristics of the tangent function.
Loading the GeoGebra board and drawing, please wait…
<?xml version="1.0" encoding="utf-8"?>
<geogebra format="5.0" version="5.0.168.0" id="96312871-1d97-4e0d-9b6a-89202ade6865" xsi:noNamespaceSchemaLocation="http://www.geogebra.org/ggb.xsd" xmlns="" xmlns:xsi="http://www.w3.org/2001/XMLSchema-instance" >
<gui>
<window width="1296" height="1000" />
<perspectives>
<perspective id="tmp">
<panes>
<pane location="" divider="0.15432098765432098" orientation="1" />
</panes>
<views>
<view id="4097" visible="false" inframe="true" stylebar="true" location="1,1,1,1" size="400" window="162,8,700,550" />
<view id="512" toolbar="0 | 1 501 5 19 , 67 | 2 15 45 18 , 7 37 | 514 3 9 , 13 44 , 47 | 16 | 551 550 11 , 20 22 21 23 , 55 56 57 , 12 | 69 | 510 511 , 512 513 | 533 531 , 534 532 , 522 523 , 537 536 , 535 | 521 520 | 36 , 38 49 560 | 571 30 29 570 31 33 | 17 | 540 40 41 42 , 27 28 35 , 6 , 502" visible="false" inframe="false" stylebar="false" location="1,1,1" size="500" window="100,100,600,400" />
<view id="4" toolbar="0 || 2020 , 2021 , 2022 , 66 || 2001 , 2003 , 2002 , 2004 , 2005 || 2040 , 2041 , 2042 , 2044 , 2043" visible="false" inframe="false" stylebar="false" location="1,1" size="300" window="100,100,600,400" />
<view id="8" toolbar="1001 | 1002 | 1003 || 1005 | 1004 || 1006 | 1007 | 1010 || 1008 1009 || 66 68 || 6" visible="false" inframe="false" stylebar="false" location="1,3" size="300" window="100,100,600,400" />
<view id="1" visible="true" inframe="false" stylebar="false" location="1" size="1064" window="100,100,600,400" />
<view id="2" visible="true" inframe="false" stylebar="false" location="3" size="200" window="100,100,250,400" />
<view id="16" visible="false" inframe="false" stylebar="false" location="1" size="150" window="50,50,500,500" />
<view id="32" visible="false" inframe="false" stylebar="true" location="1" size="150" window="50,50,500,500" />
<view id="64" toolbar="0" visible="false" inframe="true" stylebar="true" location="1" size="150" window="50,50,500,500" />
<view id="70" toolbar="0 || 2020 || 2021 || 2022" visible="false" inframe="true" stylebar="true" location="1" size="150" window="50,50,500,500" />
</views>
<toolbar show="true" items="0 39 | 1 501 67 , 5 19 , 72 | 2 15 45 , 18 65 , 7 37 | 4 3 8 9 , 13 44 , 58 , 47 | 16 51 64 , 70 | 10 34 53 11 , 24 20 22 , 21 23 | 55 56 57 , 12 | 36 46 , 38 49 50 , 71 | 30 29 54 32 31 33 | 17 26 62 73 , 14 68 | 25 52 60 61 | 40 41 42 , 27 28 35 , 6" position="1" help="false" />
<input show="true" cmd="true" top="algebra" />
<dockBar show="true" east="true" />
</perspective>
</perspectives>
<labelingStyle val="0"/>
<font size="12"/>
</gui>
<euclidianView>
<viewNumber viewNo="1"/>
<size width="1064" height="833"/>
<coordSystem xZero="215.0" yZero="315.0" scale="50.0" yscale="50.00000000000001"/>
<evSettings axes="true" grid="false" gridIsBold="false" pointCapturing="3" rightAngleStyle="1" checkboxSize="26" gridType="0"/>
<bgColor r="255" g="255" b="255"/>
<axesColor r="0" g="0" b="0"/>
<gridColor r="192" g="192" b="192"/>
<lineStyle axes="1" grid="0"/>
<axis id="0" show="true" label="" unitLabel="" tickStyle="1" showNumbers="true" tickDistance="1.5707963267948966"/>
<axis id="1" show="true" label="" unitLabel="" tickStyle="1" showNumbers="true"/>
</euclidianView>
<kernel>
<continuous val="false"/>
<usePathAndRegionParameters val="true"/>
<decimals val="2"/>
<angleUnit val="degree"/>
<algebraStyle val="0"/>
<coordStyle val="0"/>
<angleFromInvTrig val="false"/>
</kernel>
<scripting blocked="false" disabled="false"/>
<construction title="三角函數tanx函數圖形" author="" date="">
<worksheetText above="tanx" below="動態網頁"/>
<expression label="text1" exp=""y=tanx的圖形""/>
<element type="text" label="text1">
<show object="true" label="true" ev="40"/>
<objColor r="0" g="0" b="0" alpha="0.0"/>
<layer val="0"/>
<labelMode val="0"/>
<startPoint x="2.16" y="5.62" z="1.0"/>
</element>
<expression label ="f" exp="f(x) = tan(x)"/>
<element type="function" label="f">
<show object="true" label="true" ev="4"/>
<objColor r="153" g="51" b="255" alpha="0.0"/>
<layer val="0"/>
<labelOffset x="27" y="-36"/>
<labelMode val="1"/>
<animation step="1" speed="1" type="0" playing="false"/>
<lineStyle thickness="3" type="0" typeHidden="1"/>
</element>
<command name="Point">
<input a0="xAxis"/>
<output a0="A"/>
</command>
<element type="point" label="A">
<show object="true" label="true" ev="4"/>
<objColor r="125" g="125" b="255" alpha="0.0"/>
<layer val="0"/>
<labelMode val="0"/>
<animation step="0.1" speed="1" type="1" playing="false"/>
<coords x="1.5707963267948966" y="0.0" z="1.0"/>
<pointSize val="5"/>
<pointStyle val="0"/>
</element>
<command name="Point">
<input a0="xAxis"/>
<output a0="B"/>
</command>
<element type="point" label="B">
<show object="true" label="true" ev="4"/>
<objColor r="125" g="125" b="255" alpha="0.0"/>
<layer val="0"/>
<labelMode val="0"/>
<animation step="0.1" speed="1" type="1" playing="false"/>
<coords x="-1.5707963267948966" y="0.0" z="1.0"/>
<pointSize val="5"/>
<pointStyle val="0"/>
</element>
<command name="Point">
<input a0="xAxis"/>
<output a0="C"/>
</command>
<element type="point" label="C">
<show object="true" label="true" ev="4"/>
<objColor r="125" g="125" b="255" alpha="0.0"/>
<layer val="0"/>
<labelMode val="0"/>
<animation step="1" speed="1" type="1" playing="false"/>
<coords x="4.71238898038469" y="0.0" z="1.0"/>
<pointSize val="5"/>
<pointStyle val="0"/>
</element>
<command name="Point">
<input a0="xAxis"/>
<output a0="D"/>
</command>
<element type="point" label="D">
<show object="true" label="true" ev="4"/>
<objColor r="125" g="125" b="255" alpha="0.0"/>
<layer val="0"/>
<labelMode val="0"/>
<animation step="1" speed="1" type="1" playing="false"/>
<coords x="7.853981633974483" y="0.0" z="1.0"/>
<pointSize val="5"/>
<pointStyle val="0"/>
</element>
<command name="Point">
<input a0="xAxis"/>
<output a0="E"/>
</command>
<element type="point" label="E">
<show object="true" label="true" ev="4"/>
<objColor r="125" g="125" b="255" alpha="0.0"/>
<layer val="0"/>
<labelMode val="0"/>
<animation step="1" speed="1" type="1" playing="false"/>
<coords x="10.995574287564276" y="0.0" z="1.0"/>
<pointSize val="5"/>
<pointStyle val="0"/>
</element>
<command name="OrthogonalLine">
<input a0="B" a1="xAxis"/>
<output a0="a"/>
</command>
<element type="line" label="a">
<show object="true" label="true" ev="4"/>
<objColor r="255" g="0" b="0" alpha="0.0"/>
<layer val="0"/>
<labelMode val="0"/>
<coords x="-1.0" y="0.0" z="-1.5707963267948966"/>
<lineStyle thickness="2" type="15" typeHidden="1"/>
<eqnStyle style="implicit"/>
</element>
<command name="OrthogonalLine">
<input a0="A" a1="xAxis"/>
<output a0="b"/>
</command>
<element type="line" label="b">
<show object="true" label="true" ev="4"/>
<objColor r="255" g="0" b="0" alpha="0.0"/>
<layer val="0"/>
<labelMode val="0"/>
<coords x="-1.0" y="0.0" z="1.5707963267948966"/>
<lineStyle thickness="2" type="15" typeHidden="1"/>
<eqnStyle style="implicit"/>
</element>
<command name="OrthogonalLine">
<input a0="C" a1="xAxis"/>
<output a0="c"/>
</command>
<element type="line" label="c">
<show object="true" label="true" ev="4"/>
<objColor r="255" g="0" b="0" alpha="0.0"/>
<layer val="0"/>
<labelMode val="0"/>
<coords x="-1.0" y="0.0" z="4.71238898038469"/>
<lineStyle thickness="2" type="15" typeHidden="1"/>
<eqnStyle style="implicit"/>
</element>
<command name="OrthogonalLine">
<input a0="D" a1="xAxis"/>
<output a0="d"/>
</command>
<element type="line" label="d">
<show object="true" label="true" ev="4"/>
<objColor r="255" g="0" b="0" alpha="0.0"/>
<layer val="0"/>
<labelMode val="0"/>
<coords x="-1.0" y="0.0" z="7.853981633974483"/>
<lineStyle thickness="2" type="15" typeHidden="1"/>
<eqnStyle style="implicit"/>
</element>
<command name="OrthogonalLine">
<input a0="E" a1="xAxis"/>
<output a0="e"/>
</command>
<element type="line" label="e">
<show object="true" label="true"/>
<objColor r="255" g="0" b="0" alpha="0.0"/>
<layer val="0"/>
<labelMode val="0"/>
<coords x="-1.0" y="0.0" z="10.995574287564276"/>
<lineStyle thickness="2" type="15" typeHidden="1"/>
<eqnStyle style="implicit"/>
</element>
<command name="Point">
<input a0="xAxis"/>
<output a0="F"/>
</command>
<element type="point" label="F">
<show object="true" label="true"/>
<objColor r="125" g="125" b="255" alpha="0.0"/>
<layer val="0"/>
<labelMode val="0"/>
<animation step="1" speed="1" type="1" playing="false"/>
<coords x="14.137166941154069" y="0.0" z="1.0"/>
<pointSize val="5"/>
<pointStyle val="0"/>
</element>
<command name="OrthogonalLine">
<input a0="F" a1="xAxis"/>
<output a0="g"/>
</command>
<element type="line" label="g">
<show object="true" label="true"/>
<objColor r="255" g="0" b="0" alpha="0.0"/>
<layer val="0"/>
<labelMode val="0"/>
<coords x="-1.0" y="0.0" z="14.137166941154069"/>
<lineStyle thickness="2" type="15" typeHidden="1"/>
<eqnStyle style="implicit"/>
</element>
</construction>
</geogebra>