
直角坐标转换为极坐标
2018-06-23 06:07
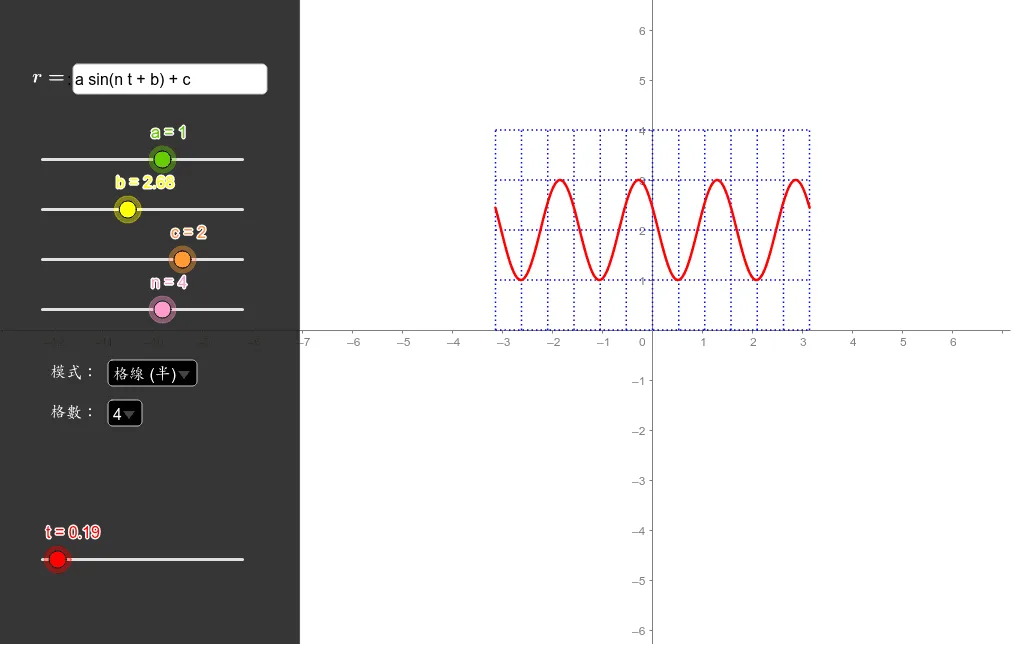
本范例演示了平面直角坐标系与极坐标系之间的转换关系。通过交互式输入或调整参数,用户可以直观地观察给定点的直角坐标如何转换为极坐标。界面展示了直角坐标网格与极坐标射线、同心圆的对应关系,帮助深入理解极径和极角的几何意义及其相互转换的数学公式。
GeoGebra 画板及绘图内容加载中,请稍等……
<?xml version="1.0" encoding="utf-8"?>
<geogebra format="5.0" version="5.0.474.0" app="classic" platform="w" id="d466dbe1-4ee3-4a4e-830b-2b8285f7be20" xsi:noNamespaceSchemaLocation="http://www.geogebra.org/ggb.xsd" xmlns="" xmlns:xsi="http://www.w3.org/2001/XMLSchema-instance" >
<gui>
<window width="1013" height="646" />
<perspectives>
<perspective id="tmp">
<panes>
<pane location="" divider="1" orientation="1" />
</panes>
<views>
<view id="512" toolbar="0 | 1 501 5 19 , 67 | 2 15 45 18 , 7 37 | 514 3 9 , 13 44 , 47 | 16 | 551 550 11 , 20 22 21 23 , 55 56 57 , 12 | 69 | 510 511 , 512 513 | 533 531 , 534 532 , 522 523 , 537 536 , 535 | 521 520 | 36 , 38 49 560 | 571 30 29 570 31 33 | 17 | 540 40 41 42 , 27 28 35 , 6 , 502" visible="false" inframe="false" stylebar="false" location="1,1,1" size="500" window="100,100,600,400" />
<view id="8" toolbar="1001 | 1002 | 1003 || 1005 | 1004 || 1006 | 1007 | 1010 || 1008 1009 || 66 68 || 6" visible="false" inframe="false" stylebar="false" location="1,3" size="300" window="100,100,600,400" />
<view id="1" visible="true" inframe="false" stylebar="true" location="3" size="1013" window="100,100,600,400" />
<view id="4" toolbar="0 || 2020 , 2021 , 2022 , 66 || 2001 , 2003 , 2002 , 2004 , 2005 || 2040 , 2041 , 2042 , 2044 , 2043" visible="false" inframe="false" stylebar="true" location="1" size="291" window="100,100,600,400" />
<view id="2" visible="false" inframe="false" stylebar="true" location="3" size="230" window="100,100,250,400" />
<view id="16" visible="false" inframe="false" stylebar="false" location="1" size="474" window="50,50,500,500" />
<view id="32" visible="false" inframe="false" stylebar="true" location="1" size="150" window="50,50,500,500" />
<view id="64" toolbar="0" visible="false" inframe="true" stylebar="true" location="1" size="150" window="50,50,500,500" />
<view id="128" visible="false" inframe="true" stylebar="false" location="1" size="480" window="50,50,500,500" />
<view id="4097" visible="false" inframe="true" stylebar="true" location="1" size="454" window="716,189,700,550" />
<view id="70" toolbar="0 || 2020 || 2021 || 2022" visible="false" inframe="true" stylebar="true" location="1" size="150" window="50,50,500,500" />
<view id="43" visible="false" inframe="false" stylebar="false" location="1" size="450" window="50,50,500,500" />
</views>
<toolbar show="false" items="0 39 73 62 | 1 501 67 , 5 19 , 72 75 76 | 2 15 45 , 18 65 , 7 37 | 4 3 8 9 , 13 44 , 58 , 47 | 16 51 64 , 70 | 10 34 53 11 , 24 20 22 , 21 23 | 55 56 57 , 12 | 36 46 , 38 49 50 , 71 14 68 | 30 29 54 32 31 33 | 25 17 26 60 52 61 | 40 41 42 , 27 28 35 , 6 | 100004 100002" position="1" help="false" />
<input show="false" cmd="true" top="algebra" />
<dockBar show="false" east="false" />
</perspective>
</perspectives>
<labelingStyle val="3"/>
<font size="16"/>
</gui>
<euclidianView>
<viewNumber viewNo="1"/>
<size width="1013" height="646"/>
<coordSystem xZero="652.5" yZero="330.00000000000006" scale="49.999999999999986" yscale="50.00000000000002"/>
<evSettings axes="true" grid="false" gridIsBold="false" pointCapturing="0" rightAngleStyle="1" checkboxSize="26" gridType="0"/>
<bgColor r="255" g="255" b="255"/>
<axesColor r="128" g="128" b="128"/>
<gridColor r="192" g="192" b="192"/>
<lineStyle axes="0" grid="0"/>
<axis id="0" show="true" label="" unitLabel="" tickStyle="1" showNumbers="true" tickDistance="1" tickExpression="1" selectionAllowed="false"/>
<axis id="1" show="true" label="" unitLabel="" tickStyle="1" showNumbers="true" tickDistance="1" tickExpression="1" selectionAllowed="false"/>
</euclidianView>
<kernel>
<continuous val="false"/>
<usePathAndRegionParameters val="true"/>
<decimals val="2"/>
<angleUnit val="degree"/>
<algebraStyle val="0" spreadsheet="0"/>
<coordStyle val="0"/>
<startAnimation val="true"/>
</kernel>
<scripting blocked="false" disabled="false"/>
<construction title="" author="" date="">
<expression label ="grids" exp="{1, 2, 3, 4, 5, 6, 7, 8}"/>
<element type="list" label="grids">
<show object="true" label="true" ev="4"/>
<objColor r="255" g="255" b="255" alpha="0.10000000149011612"/>
<bgColor r="0" g="0" b="0" alpha="255"/>
<layer val="0"/>
<labelOffset x="50" y="400"/>
<labelMode val="3"/>
<animation step="1" speed="1" type="0" playing="false"/>
<lineStyle thickness="2" type="0" typeHidden="1"/>
<selectedIndex val="3"/>
<comboBox val="true"/>
<pointSize val="5"/>
<pointStyle val="-1"/>
<symbolic val="true" />
<caption val="格數:"/>
</element>
<element type="numeric" label="t">
<value val="0.19"/>
<show object="true" label="true"/>
<objColor r="255" g="0" b="0" alpha="0.10000000149011612"/>
<bgColor r="224" g="224" b="224" alpha="255"/>
<layer val="0"/>
<labelMode val="1"/>
<slider min="0" max="2.5" absoluteScreenLocation="true" width="200" x="42" y="560" fixed="true" horizontal="true" showAlgebra="true"/>
<pointSize val="8"/>
<lineStyle thickness="6" type="0" typeHidden="1"/>
<animation step="0.01" speed="1" type="0" playing="true"/>
</element>
<command name="clamp">
<input a0="t" a1="0.3" a2="1"/>
<output a0="t1"/>
</command>
<element type="numeric" label="t1">
<value val="0"/>
<symbolic val="true" />
<objColor r="0" g="0" b="0" alpha="0.10000000149011612"/>
</element>
<element type="numeric" label="a">
<value val="1"/>
<symbolic val="true" />
<show object="true" label="true"/>
<objColor r="102" g="204" b="0" alpha="0.10000000149011612"/>
<bgColor r="224" g="224" b="224" alpha="255"/>
<layer val="0"/>
<labelMode val="1"/>
<slider min="-5" max="5" absoluteScreenLocation="true" width="200" x="42" y="160" fixed="true" horizontal="true" showAlgebra="false"/>
<pointSize val="8"/>
<lineStyle thickness="6" type="0" typeHidden="1"/>
<animation step="0.1" speed="1" type="0" playing="false"/>
</element>
<element type="numeric" label="b">
<value val="2.68"/>
<symbolic val="true" />
<show object="true" label="true"/>
<objColor r="255" g="255" b="0" alpha="0.10000000149011612"/>
<bgColor r="224" g="224" b="224" alpha="255"/>
<layer val="0"/>
<labelMode val="1"/>
<slider min="0" max="(2 * π)" absoluteScreenLocation="true" width="200" x="42" y="210" fixed="true" horizontal="true" showAlgebra="false"/>
<pointSize val="8"/>
<lineStyle thickness="6" type="0" typeHidden="1"/>
<animation step="0.01" speed="2" type="1" playing="true"/>
</element>
<element type="numeric" label="n">
<value val="4"/>
<symbolic val="true" />
<show object="true" label="true"/>
<objColor r="255" g="153" b="204" alpha="0.10000000149011612"/>
<bgColor r="224" g="224" b="224" alpha="255"/>
<layer val="0"/>
<labelMode val="1"/>
<slider min="1" max="6" absoluteScreenLocation="true" width="200" x="42" y="310" fixed="true" horizontal="true" showAlgebra="false"/>
<pointSize val="8"/>
<lineStyle thickness="6" type="0" typeHidden="1"/>
<animation step="0.1" speed="1" type="0" playing="false"/>
</element>
<element type="numeric" label="c">
<value val="2"/>
<symbolic val="true" />
<show object="true" label="true"/>
<objColor r="255" g="153" b="51" alpha="0.10000000149011612"/>
<bgColor r="224" g="224" b="224" alpha="255"/>
<layer val="0"/>
<labelMode val="1"/>
<slider min="-5" max="5" absoluteScreenLocation="true" width="200" x="42" y="260" fixed="true" horizontal="true" showAlgebra="false"/>
<pointSize val="8"/>
<lineStyle thickness="6" type="0" typeHidden="1"/>
<animation step="0.1" speed="1" type="0" playing="false"/>
</element>
<expression label="f" exp="f(t) = (a * sin((n * t) + b)) + c" />
<element type="function" label="f">
<show object="false" label="false" ev="4"/>
<objColor r="153" g="51" b="255" alpha="0"/>
<layer val="0"/>
<labelMode val="0"/>
<lineStyle thickness="3" type="0" typeHidden="1"/>
</element>
<command name="clamp">
<input a0="t" a1="1.3" a2="2"/>
<output a0="t2"/>
</command>
<element type="numeric" label="t2">
<value val="0"/>
<symbolic val="true" />
<objColor r="0" g="0" b="0" alpha="0.10000000149011612"/>
</element>
<expression label ="r_x" exp="r_x(x, y, t) = ((1 - t) * x) + (t * y)"/>
<element type="functionNVar" label="r_x">
<show object="false" label="false" ev="4"/>
<objColor r="204" g="0" b="0" alpha="0.75"/>
<layer val="0"/>
<labelMode val="0"/>
<animation step="0.1" speed="1" type="0" playing="false"/>
</element>
<expression label ="r_y" exp="r_y(x, y, t) = ((1 - t) * y) + (t * x)"/>
<element type="functionNVar" label="r_y">
<show object="false" label="false" ev="4"/>
<objColor r="204" g="0" b="0" alpha="0.75"/>
<layer val="0"/>
<labelMode val="0"/>
<animation step="0.1" speed="1" type="0" playing="false"/>
</element>
<expression label ="p_x" exp="p_x(x, y, t) = (x * cos((t * y)))"/>
<element type="functionNVar" label="p_x">
<show object="false" label="false" ev="4"/>
<objColor r="204" g="0" b="0" alpha="0.75"/>
<layer val="0"/>
<labelMode val="0"/>
<animation step="0.1" speed="1" type="0" playing="false"/>
</element>
<expression label ="p_y" exp="p_y(x, y, t) = ((1 - t) * y) + (x * sin((t * y)))"/>
<element type="functionNVar" label="p_y">
<show object="false" label="false" ev="4"/>
<objColor r="204" g="0" b="0" alpha="0.75"/>
<layer val="0"/>
<labelMode val="0"/>
<animation step="0.1" speed="1" type="0" playing="false"/>
</element>
<expression label="rp_x" exp="rp_x(x, y) = p_x(r_x(x, y, t1), r_y(x, y, t1), t2)" />
<element type="functionNVar" label="rp_x">
<show object="false" label="false" ev="4"/>
<objColor r="153" g="51" b="0" alpha="0.75"/>
<layer val="0"/>
<labelMode val="0"/>
<lineStyle thickness="1" type="0" typeHidden="1"/>
</element>
<expression label="rp_y" exp="rp_y(x, y) = p_y(r_x(x, y, t1), r_y(x, y, t1), t2)" />
<element type="functionNVar" label="rp_y">
<show object="false" label="false" ev="4"/>
<objColor r="0" g="100" b="0" alpha="0.75"/>
<layer val="0"/>
<labelMode val="0"/>
<lineStyle thickness="1" type="0" typeHidden="1"/>
</element>
<command name="SelectedElement">
<input a0="grids"/>
<output a0="m"/>
</command>
<element type="numeric" label="m">
<value val="4"/>
<symbolic val="true" />
<objColor r="0" g="0" b="255" alpha="0.10000000149011612"/>
<bgColor r="224" g="224" b="224" alpha="255"/>
</element>
<command name="CurveCartesian">
<input a0="rp_x(s, f(s))" a1="rp_y(s, f(s))" a2="s" a3="(-π)" a4="π"/>
<output a0="graph"/>
</command>
<element type="curvecartesian" label="graph">
<show object="true" label="false" ev="4"/>
<objColor r="255" g="0" b="0" alpha="0"/>
<layer val="0"/>
<labelMode val="0"/>
<selectionAllowed val="false"/>
<lineStyle thickness="5" type="0" typeHidden="1"/>
</element>
<command name="Textfield">
<input a0="f"/>
<output a0="inputBox1"/>
</command>
<element type="textfield" label="inputBox1">
<show object="true" label="true"/>
<objColor r="0" g="0" b="0" alpha="0"/>
<layer val="0"/>
<labelOffset x="67" y="64"/>
<labelMode val="3"/>
<auxiliary val="true"/>
<linkedGeo exp="f"/>
<length val="15"/>
<caption val=":"/>
</element>
<expression label="pixels" exp="x(Corner[2] - Corner[1]) / x(Corner[5])" />
<element type="numeric" label="pixels">
<value val="0.020039486673247786"/>
<symbolic val="true" />
<objColor r="0" g="0" b="0" alpha="0.10000000149011612"/>
</element>
<expression label="kWidth" exp="(300 * pixels)" />
<element type="numeric" label="kWidth">
<value val="6.011846001974336"/>
<symbolic val="true" />
<objColor r="0" g="0" b="0" alpha="0.10000000149011612"/>
</element>
<expression label ="i" exp="(1, 0)" type="vector"/>
<element type="vector" label="i">
<show object="false" label="false" ev="4"/>
<objColor r="0" g="0" b="0" alpha="0"/>
<layer val="0"/>
<labelMode val="0"/>
<fixed val="true"/>
<coords x="1" y="0" z="0"/>
<lineStyle thickness="2" type="0" typeHidden="1"/>
<coordStyle style="cartesian"/>
</element>
<expression label ="j" exp="(0, 1)" type="vector"/>
<element type="vector" label="j">
<show object="false" label="false" ev="4"/>
<objColor r="0" g="0" b="0" alpha="0"/>
<layer val="0"/>
<labelMode val="0"/>
<fixed val="true"/>
<coords x="0" y="1" z="0"/>
<lineStyle thickness="2" type="0" typeHidden="1"/>
<coordStyle style="cartesian"/>
</element>
<command name="Corner">
<input a0="1"/>
<output a0="C1"/>
</command>
<element type="point" label="C1">
<show object="false" label="true" ev="4"/>
<objColor r="68" g="68" b="68" alpha="0"/>
<layer val="0"/>
<labelMode val="0"/>
<coords x="-13.070000000000006" y="-6.339999999999995" z="1"/>
<pointSize val="3"/>
<pointStyle val="0"/>
</element>
<command name="Polygon">
<input a0="{C1, C1 + (kWidth * i), Corner[4] + (kWidth * i), Corner[4]}"/>
<output a0="banner"/>
</command>
<element type="polygon" label="banner">
<lineStyle thickness="1" type="0" typeHidden="1"/>
<show object="true" label="false" ev="4"/>
<objColor r="32" g="32" b="32" alpha="0.8999999761581421"/>
<layer val="0"/>
<labelMode val="0"/>
</element>
<expression label="text1" exp=""r=""/>
<element type="text" label="text1">
<show object="true" label="false" ev="40"/>
<objColor r="255" g="255" b="255" alpha="0"/>
<layer val="0"/>
<labelMode val="0"/>
<isLaTeX val="true"/>
<font serif="true" sizeM="1" size="0" style="1"/>
<absoluteScreenLocation x="28" y="67"/>
</element>
<expression label ="modes" exp="{"無格線", "格線 (半)", "格線 (全)"}"/>
<element type="list" label="modes">
<show object="true" label="true" ev="4"/>
<objColor r="255" g="255" b="255" alpha="0.10000000149011612"/>
<bgColor r="0" g="0" b="0" alpha="255"/>
<layer val="0"/>
<labelOffset x="50" y="360"/>
<labelMode val="3"/>
<animation step="1" speed="1" type="0" playing="false"/>
<lineStyle thickness="2" type="0" typeHidden="1"/>
<selectedIndex val="1"/>
<comboBox val="true"/>
<pointSize val="5"/>
<pointStyle val="-1"/>
<caption val="模式:"/>
</element>
<command name="SelectedIndex">
<input a0="modes"/>
<output a0="mode"/>
</command>
<element type="numeric" label="mode">
<value val="2"/>
<symbolic val="true" />
<objColor r="0" g="0" b="0" alpha="0.10000000149011612"/>
</element>
<command name="If">
<input a0="mode ≟ 3" a1="(-m)" a2="0"/>
<output a0="kLowerBound"/>
</command>
<element type="numeric" label="kLowerBound">
<value val="0"/>
<symbolic val="true" />
<objColor r="0" g="0" b="0" alpha="0.10000000149011612"/>
</element>
<command name="Sequence">
<input a0="CurveCartesian[rp_x(s, k), rp_y(s, k), s, (-π), π]" a1="k" a2="kLowerBound" a3="m"/>
<output a0="linesR"/>
</command>
<element type="list" label="linesR">
<show object="true" label="false" ev="8"/>
<condition showObject="mode ≠ 1"/>
<objColor r="0" g="0" b="255" alpha="0"/>
<layer val="0"/>
<labelMode val="0"/>
<selectionAllowed val="false"/>
<lineStyle thickness="3" type="20" typeHidden="1"/>
<pointSize val="5"/>
<pointStyle val="-1"/>
</element>
<command name="Sequence">
<input a0="CurveCartesian[rp_x((k * π), s), rp_y((k * π), s), s, kLowerBound, m]" a1="k" a2="-1" a3="1" a4="1 / 6"/>
<output a0="linesTheta"/>
</command>
<element type="list" label="linesTheta">
<show object="true" label="false" ev="8"/>
<condition showObject="mode ≠ 1"/>
<objColor r="0" g="0" b="255" alpha="0"/>
<layer val="0"/>
<labelMode val="0"/>
<selectionAllowed val="false"/>
<lineStyle thickness="3" type="20" typeHidden="1"/>
<pointSize val="5"/>
<pointStyle val="-1"/>
</element>
</construction>
</geogebra>