
三次多项式的切线
2017-03-28 05:51
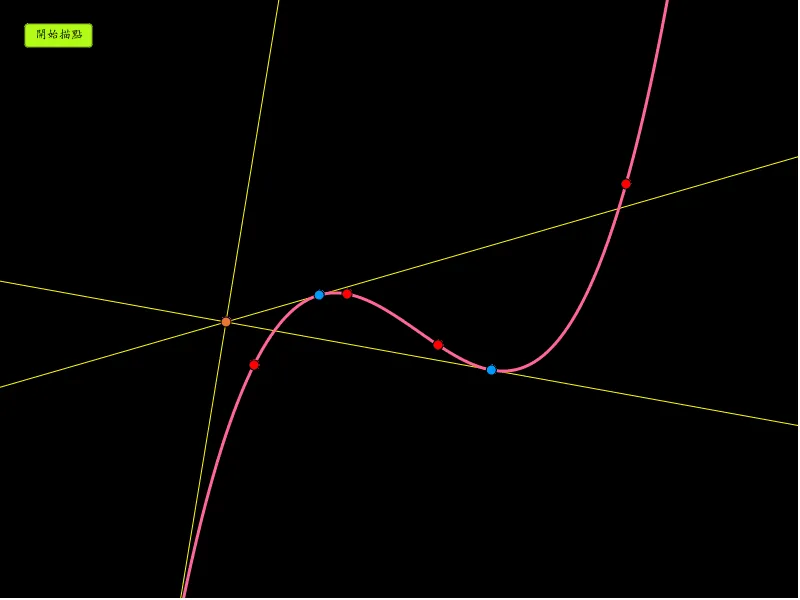
本范例演示了三次多项式函数及其切线的几何性质。通过动态调整曲线上的点,可以直观地观察切线斜率和位置的变化。支持开启轨迹追踪功能,帮助深入理解导数与切线之间的几何关系,适合微积分和函数图像的教学与探索。
所属专题
微积分
GeoGebra 画板及绘图内容加载中,请稍等……
<?xml version="1.0" encoding="utf-8"?>
<geogebra format="5.0" version="5.0.348.0" id="b52350d9-4c34-46f2-ae4a-67a69771216e" xsi:noNamespaceSchemaLocation="http://www.geogebra.org/ggb.xsd" xmlns="" xmlns:xsi="http://www.w3.org/2001/XMLSchema-instance" >
<gui>
<window width="800" height="600" />
<perspectives>
<perspective id="tmp">
<panes>
<pane location="" divider="-0.0025" orientation="1" />
</panes>
<views>
<view id="512" toolbar="0 | 1 501 5 19 , 67 | 2 15 45 18 , 7 37 | 514 3 9 , 13 44 , 47 | 16 | 551 550 11 , 20 22 21 23 , 55 56 57 , 12 | 69 | 510 511 , 512 513 | 533 531 , 534 532 , 522 523 , 537 536 , 535 | 521 520 | 36 , 38 49 560 | 571 30 29 570 31 33 | 17 | 540 40 41 42 , 27 28 35 , 6 , 502" visible="false" inframe="false" stylebar="false" location="1,1,1" size="500" window="100,100,600,400" />
<view id="4" toolbar="0 || 2020 , 2021 , 2022 , 66 || 2001 , 2003 , 2002 , 2004 , 2005 || 2040 , 2041 , 2042 , 2044 , 2043" visible="false" inframe="false" stylebar="false" location="1,1" size="300" window="100,100,600,400" />
<view id="8" toolbar="1001 | 1002 | 1003 || 1005 | 1004 || 1006 | 1007 | 1010 || 1008 1009 || 66 68 || 6" visible="false" inframe="false" stylebar="false" location="1,3" size="300" window="100,100,600,400" />
<view id="4097" visible="false" inframe="true" stylebar="true" location="1,1" size="380" window="275,120,832,718" />
<view id="1" visible="true" inframe="false" stylebar="true" location="1" size="798" window="100,100,600,400" />
<view id="2" visible="false" inframe="false" stylebar="false" location="3" size="235" window="100,100,250,400" />
<view id="16" visible="false" inframe="false" stylebar="false" location="1" size="474" window="50,50,500,500" />
<view id="32" visible="false" inframe="false" stylebar="true" location="1" size="150" window="50,50,500,500" />
<view id="64" toolbar="0" visible="false" inframe="true" stylebar="true" location="1" size="150" window="50,50,500,500" />
<view id="128" visible="false" inframe="true" stylebar="false" location="1" size="480" window="50,50,500,500" />
<view id="70" toolbar="0 || 2020 || 2021 || 2022" visible="false" inframe="true" stylebar="true" location="1" size="150" window="50,50,500,500" />
<view id="43" visible="false" inframe="false" stylebar="false" location="1" size="450" window="50,50,500,500" />
</views>
<toolbar show="false" items="0 39 73 62 | 1 501 67 , 5 19 , 72 75 76 | 2 15 45 , 18 65 , 7 37 | 4 3 8 9 , 13 44 , 58 , 47 | 16 51 64 , 70 | 10 34 53 11 , 24 20 22 , 21 23 | 55 56 57 , 12 | 36 46 , 38 49 50 , 71 14 68 | 30 29 54 32 31 33 | 25 17 26 60 52 61 | 40 41 42 , 27 28 35 , 6 ||" position="1" help="false" />
<input show="false" cmd="true" top="algebra" />
<dockBar show="false" east="false" />
</perspective>
</perspectives>
<labelingStyle val="3"/>
<font size="16"/>
</gui>
<euclidianView>
<viewNumber viewNo="1"/>
<size width="798" height="598"/>
<coordSystem xZero="412.07524999999976" yZero="288.5970999999994" scale="71.54124999999998" yscale="71.54124999999998"/>
<evSettings axes="false" grid="false" gridIsBold="false" pointCapturing="3" rightAngleStyle="1" checkboxSize="26" gridType="0"/>
<bgColor r="0" g="0" b="0"/>
<axesColor r="0" g="0" b="0"/>
<gridColor r="192" g="192" b="192"/>
<lineStyle axes="1" grid="0"/>
<axis id="0" show="false" label="" unitLabel="" tickStyle="1" showNumbers="true"/>
<axis id="1" show="false" label="" unitLabel="" tickStyle="1" showNumbers="true"/>
</euclidianView>
<kernel>
<continuous val="false"/>
<usePathAndRegionParameters val="true"/>
<decimals val="2"/>
<angleUnit val="degree"/>
<algebraStyle val="0" spreadsheet="0"/>
<coordStyle val="0"/>
</kernel>
<scripting blocked="false" disabled="false"/>
<construction title="" author="" date="">
<element type="point" label="J">
<show object="true" label="false" ev="4"/>
<objColor r="255" g="0" b="0" alpha="0"/>
<layer val="0"/>
<labelMode val="0"/>
<animation step="0.1" speed="1" type="1" playing="false"/>
<isShape val="false"/>
<coords x="2.9902294131008307" y="1.4620530113745518" z="1"/>
<pointSize val="5"/>
<pointStyle val="0"/>
</element>
<element type="point" label="I">
<show object="true" label="false" ev="4"/>
<objColor r="255" g="0" b="0" alpha="0"/>
<layer val="0"/>
<labelMode val="0"/>
<animation step="0.1" speed="1" type="1" playing="false"/>
<isShape val="false"/>
<coords x="0.3623748536683374" y="-0.7883969038841248" z="1"/>
<pointSize val="5"/>
<pointStyle val="0"/>
</element>
<element type="point" label="H">
<show object="true" label="false" ev="4"/>
<objColor r="255" g="0" b="0" alpha="0"/>
<layer val="0"/>
<labelMode val="0"/>
<animation step="0.1" speed="1" type="1" playing="false"/>
<isShape val="false"/>
<coords x="-0.9096185766952631" y="-0.0755214648891403" z="1"/>
<pointSize val="5"/>
<pointStyle val="0"/>
</element>
<element type="point" label="G">
<show object="true" label="false" ev="4"/>
<objColor r="255" g="0" b="0" alpha="0"/>
<layer val="0"/>
<labelMode val="0"/>
<animation step="0.1" speed="1" type="1" playing="false"/>
<isShape val="false"/>
<coords x="-2.2095679066272944" y="-1.0679558995684324" z="1"/>
<pointSize val="5"/>
<pointStyle val="0"/>
</element>
<command name="Polynomial">
<input a0="{G, H, I, J}"/>
<output a0="f"/>
</command>
<element type="function" label="f">
<show object="true" label="false" ev="4"/>
<objColor r="255" g="102" b="153" alpha="0"/>
<layer val="0"/>
<labelMode val="0"/>
<selectionAllowed val="false"/>
<isShape val="false"/>
<lineStyle thickness="6" type="0" typeHidden="1"/>
</element>
<element type="point" label="A">
<show object="true" label="false" ev="4"/>
<objColor r="0" g="0" b="255" alpha="0" dynamicr="red(n)" dynamicg="green(n)" dynamicb="blue(n)" colorSpace="0"/>
<layer val="0"/>
<labelMode val="0"/>
<animation step="1" speed="1" type="1" playing="false"/>
<isShape val="false"/>
<coords x="-2.6009505005853253" y="-0.466904058847171" z="1"/>
<pointSize val="5"/>
<pointStyle val="0"/>
</element>
<expression label="g" exp="g(x) = ((x - x(A)) * f'(x)) - f(x) + y(A)" />
<element type="function" label="g">
<show object="false" label="false" ev="4"/>
<objColor r="0" g="0" b="0" alpha="0"/>
<layer val="0"/>
<labelMode val="0"/>
<isShape val="false"/>
<lineStyle thickness="2" type="0" typeHidden="1"/>
</element>
<expression label="s" exp="{Root[g]}" />
<element type="list" label="s">
<show object="false" label="true" ev="4"/>
<objColor r="68" g="68" b="68" alpha="0"/>
<bgColor r="255" g="255" b="255" alpha="255"/>
<layer val="0"/>
<labelMode val="0"/>
<selectionAllowed val="false"/>
<isShape val="false"/>
<lineStyle thickness="2" type="0" typeHidden="1"/>
<pointSize val="3"/>
<pointStyle val="0"/>
</element>
<expression label ="red" exp="red(k) = If[k ≟ 1, 251, k ≟ 2, 244, k ≟ 3, 239, 0] / 255"/>
<element type="function" label="red">
<show object="false" label="true" ev="4"/>
<objColor r="255" g="85" b="0" alpha="0"/>
<layer val="0"/>
<labelMode val="0"/>
<animation step="1" speed="1" type="0" playing="false"/>
<isShape val="false"/>
<lineStyle thickness="3" type="0" typeHidden="1"/>
</element>
<expression label ="green" exp="green(k) = If[k ≟ 1, 183, k ≟ 2, 139, k ≟ 3, 112, 0] / 255"/>
<element type="function" label="green">
<show object="false" label="false" ev="4"/>
<objColor r="0" g="0" b="255" alpha="0"/>
<layer val="0"/>
<labelMode val="0"/>
<animation step="1" speed="1" type="0" playing="false"/>
<isShape val="false"/>
<lineStyle thickness="3" type="0" typeHidden="1"/>
</element>
<expression label ="blue" exp="blue(k) = If[k ≟ 1, 49, k ≟ 2, 49, k ≟ 3, 48, 0] / 255"/>
<element type="function" label="blue">
<show object="false" label="false" ev="4"/>
<objColor r="204" g="0" b="0" alpha="0"/>
<layer val="0"/>
<labelMode val="0"/>
<animation step="1" speed="1" type="0" playing="false"/>
<isShape val="false"/>
<lineStyle thickness="3" type="0" typeHidden="1"/>
</element>
<element type="boolean" label="showTrace">
<value val="false"/>
<show object="false" label="true"/>
<objColor r="0" g="0" b="0" alpha="0"/>
<layer val="0"/>
<labelMode val="0"/>
<checkbox fixed="true"/>
</element>
<element type="button" label="btnTrace">
<show object="true" label="true"/>
<objColor r="0" g="0" b="0" alpha="1"/>
<bgColor r="177" g="251" b="23" alpha="255"/>
<layer val="0"/>
<labelOffset x="25" y="24"/>
<labelMode val="3"/>
<fixed val="true"/>
<isShape val="false"/>
<auxiliary val="true"/>
<ggbscript val="SetValue[showTrace, !showTrace] SetCaption[btnTrace, If[showTrace, "清除痕跡", "開始描點"]] SetBackgroundColor[btnTrace, If[showTrace, "pink", "GREENYELLOW"]] ZoomIn[1] SetTrace[A, showTrace]"/>
<caption val="開始描點"/>
</element>
<command name="Zip">
<input a0="(x(P), f(x(P)))" a1="P" a2="s"/>
<output a0="points"/>
</command>
<element type="list" label="points">
<show object="true" label="false" ev="4"/>
<objColor r="0" g="153" b="255" alpha="0"/>
<bgColor r="255" g="255" b="255" alpha="255"/>
<layer val="1"/>
<labelMode val="0"/>
<selectionAllowed val="false"/>
<isShape val="false"/>
<lineStyle thickness="2" type="0" typeHidden="1"/>
<pointSize val="5"/>
<pointStyle val="-1"/>
</element>
<command name="Zip">
<input a0="Tangent[P, f]" a1="P" a2="s"/>
<output a0="lines"/>
</command>
<element type="list" label="lines">
<show object="true" label="false" ev="4"/>
<objColor r="255" g="255" b="0" alpha="0"/>
<bgColor r="255" g="255" b="255" alpha="255"/>
<layer val="0"/>
<labelMode val="0"/>
<selectionAllowed val="false"/>
<isShape val="false"/>
<lineStyle thickness="2" type="0" typeHidden="1"/>
<pointSize val="5"/>
<pointStyle val="-1"/>
</element>
<command name="Length">
<input a0="s"/>
<output a0="n"/>
</command>
<element type="numeric" label="n">
<value val="3"/>
<symbolic val="true" />
<objColor r="0" g="0" b="0" alpha="0.10000000149011612"/>
</element>
</construction>
</geogebra>